
Professional graphics require code
In order to visualize the location of oligonucleotide primers as well as structural rearrangements in plastid genomes, I wrote some Latex code.
\documentclass[margin=10pt]{standalone}

\usepackage{tikz}

\begin{document}

\begin{tikzpicture}[line cap=rect,line width=3pt]

\draw[] (0,0) circle [radius=8cm];

% Draw small intervals, label small intervals

\foreach \angle [count=\xi, evaluate=\xi as \xx using int(\xi*10)] in {157.5,135,...,-157.5,-180}{

\draw[line width=1.5pt] (\angle:7.8cm) – (\angle:8.2cm);

\node[font=\large] at (\angle:9cm) {\xx ,000};

}

% Draw quater intervals

\foreach \angle [] in {0,-90,-180,-270}{

\draw[line width=3pt] (\angle:7.7cm) – (\angle:8.3cm);

}

% Draw origin

\draw[line width=3pt] (-182:7.7cm) – (-182:8.3cm);

\node[font=\large] at (-182:9cm) {origin};

% Draw IRs

\draw[line width=5pt,gray] ([shift=(-90:5cm)]5,0) arc (-45:-90:7cm);

\draw[line width=5pt,gray] ([shift=(-180:5cm)]0,-5) arc (-135:-180:7cm);

% Label IRs

\node[font=\large, gray] at (-157.5:6.5cm) {IRa};

\node[font=\large, gray] at (-67.5:6.5cm) {IRb};

\end{tikzpicture}

\end{document}
When compiled, the above code generates the following image:
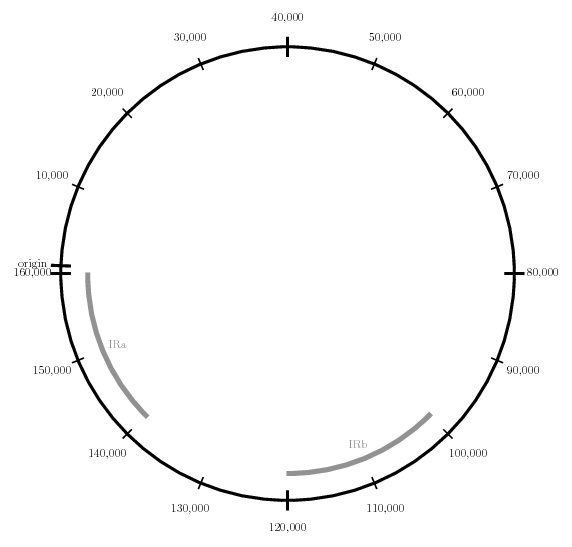
Schematic of Plastid Genome
A thank you goes to some fellow LaTeX Stack Exchange users, who assisted with the above code.