Set of four distinct data sets constructed by a statistician Francin Anscombe in 1973. All four sets have almost the same statistical observations, included mean, variance, correlation and number of elements (11), however they have different distributions which results in distinguishments in plotting on the graph.
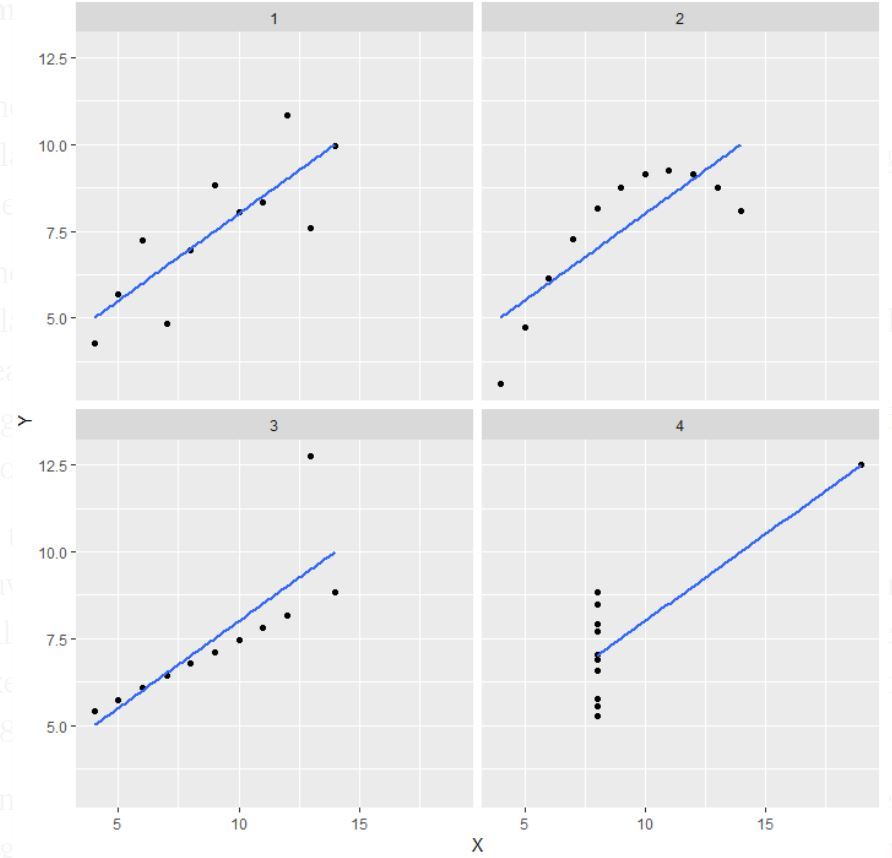
Although particular points on the graph of each set are not corresponding, each dataset produces the same statistical properties and is represented with the similar linear function. This quartet model is used to show importance of data visualization and plotting datasets on the graph. Even though each dataset generate similar statistical properties, in fact it looks different on the graph. Thus, datasets should be firstly analyzed graphically, before performing relationship analyse and interpretation.
It is not exactly known how Francinc Anscombe constructed this model, however nowadays there are more models with similar properties, which is identical statistics and dissimilar graphics.
[1] Matejka, J., Fitzmarice, G., (2017). Same Stats, Different Graphs: Generating Datasets with Varied Appearance and Identical Statistics through Simulated Annealing
[2] VL 11-02 | Advanced Topics in HCI: Data Visualization, HCI SoSe 2021