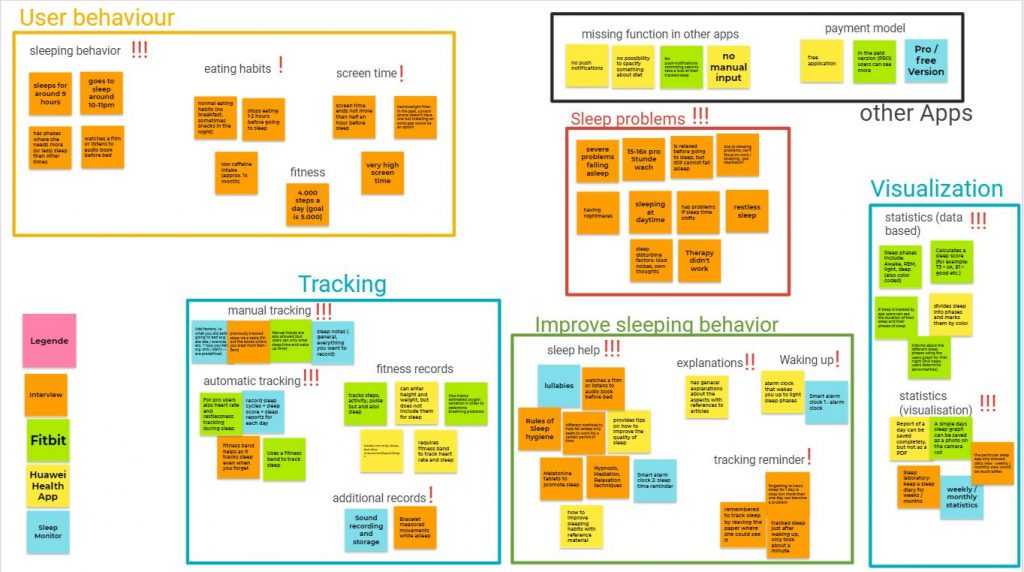
Affinity Diagramming
For this task we used the website Google Jamboard
Here is an explanation for the different colours we used:
- Share Data
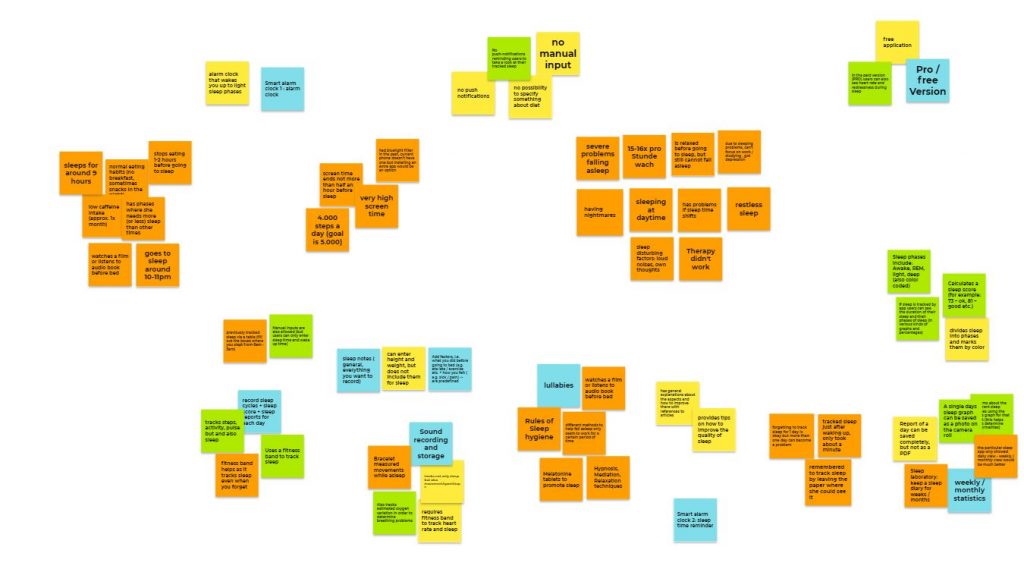
At first we put each information on a sticky note and sorted them by the different data gathering method we used namely interview and markt analysis:
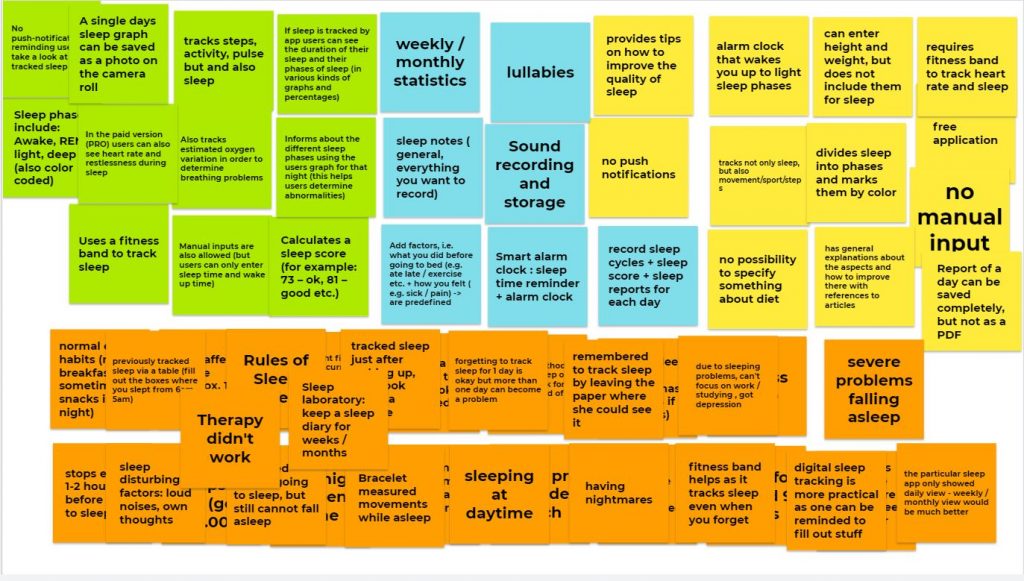
2. Clustering
Then we organzied them into different categories…
3. Headlines
…and gave them headlines:
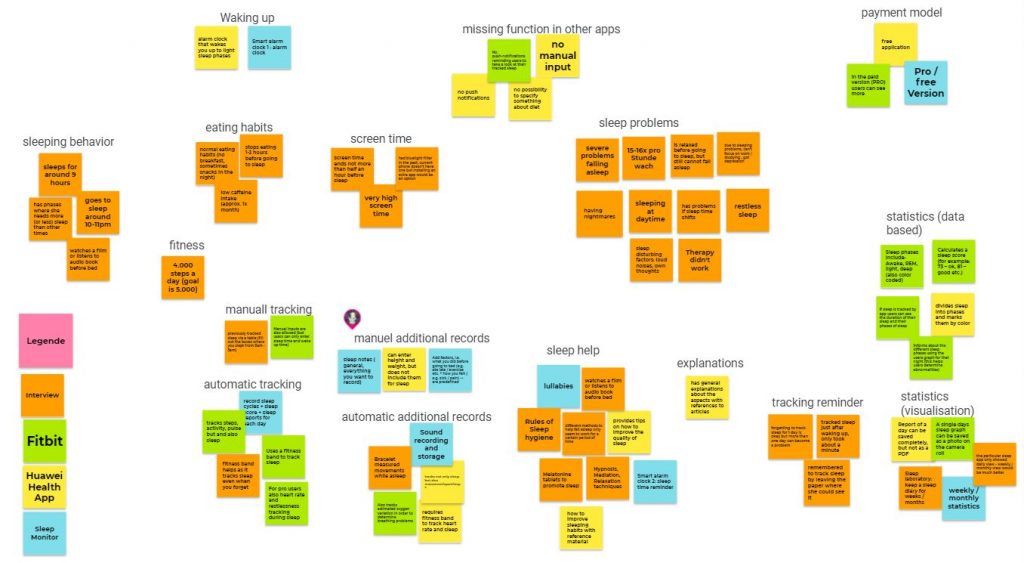
4. Super Headlines
Then we discussed if we could combine some categories or not and gave
these new categories headlines too.
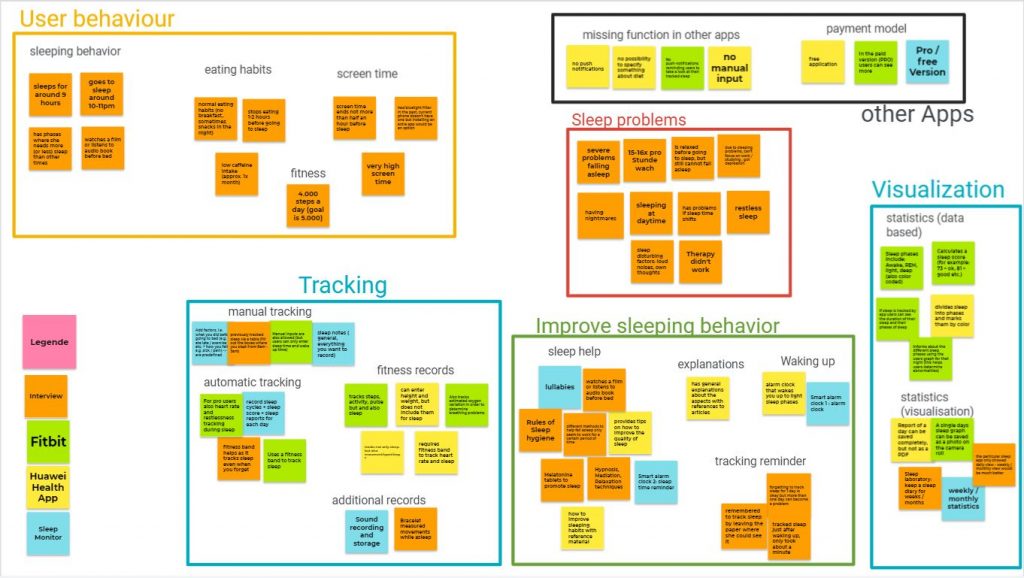
There you will see that some of our undercategories changed a bit due to our
constant discussions about the informations that we gathered.
5. Prioritize
In this final step we prioritized each category as to whether it is super
important for designing our mobile application or not.