[A#3, P7] Veritas – Conceptual Model

In the previous week we interviewed three students in our target group and conducted a public survey to get an overview on how the general public forms their opinion on political topics.

In total we received 122 responses to our questionnaire, of which 61% are male and 56% are students. Most of the participants (78%) are younger than 36 years.

1. Affinity Diagramming

Our questionnaire consists of 15 questions, including 13 multiple-choice questions and two text-field questions. We used the responses to the question What are your usual steps when trying to form an opinion on a controversial topic? as input for our affinity diagram because it received the most qualitative answers.

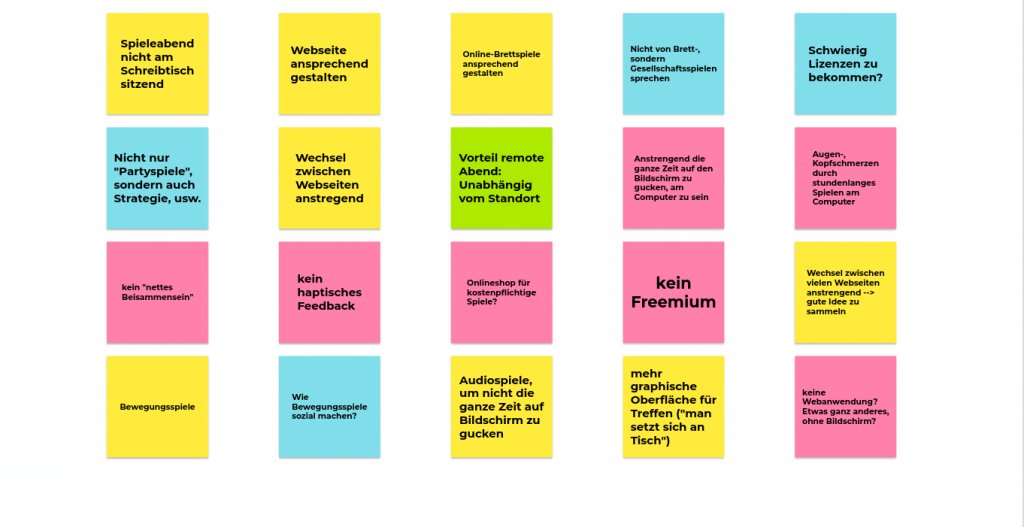
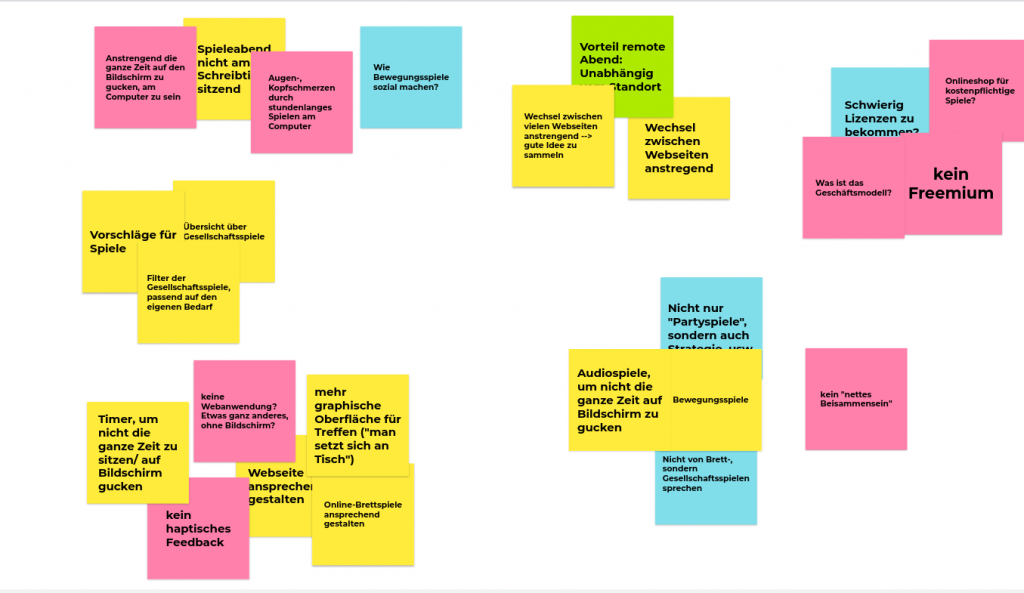
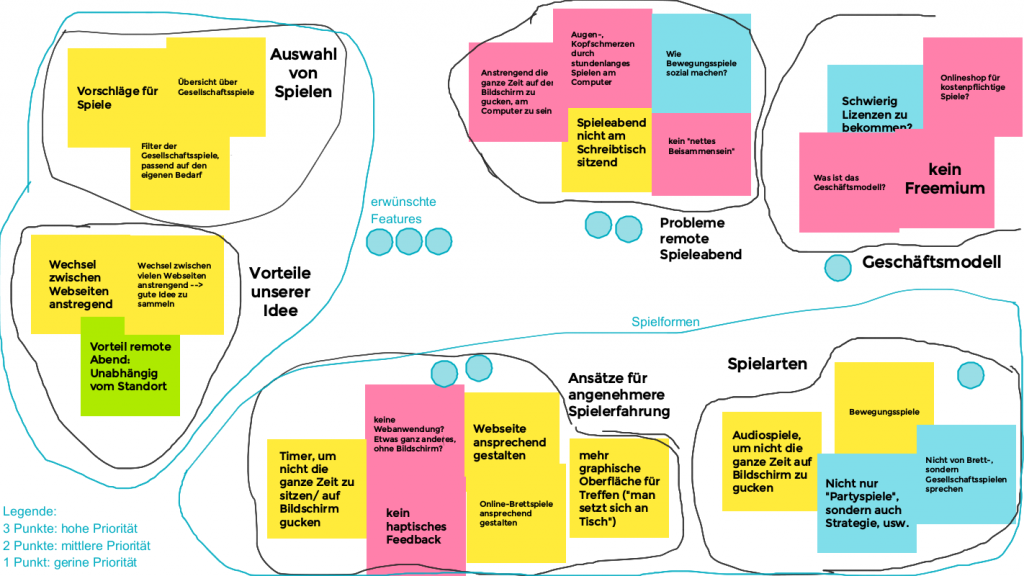
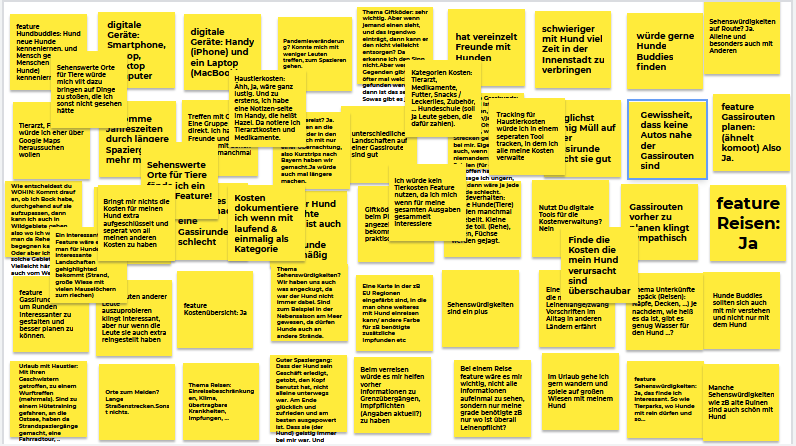
We used miro.com to sort through and categorize the responses. The below image shows the initial state of the diagram.

https://cdn.discordapp.com/attachments/834058821948276749/839150273712226334/Screen_Shot_2021-05-04_at_16.18.31.png
Initial state of the affinity diagram.

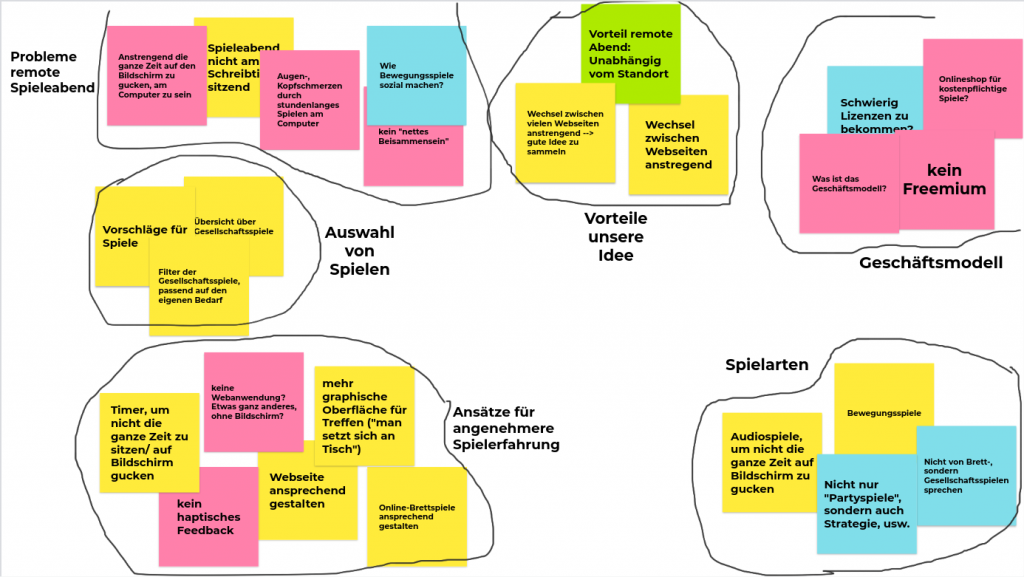
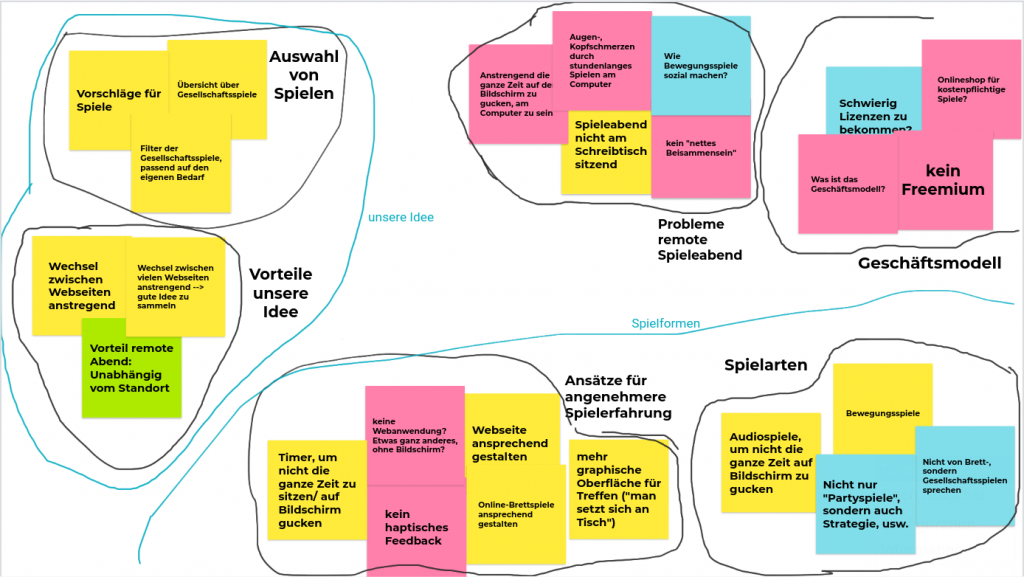
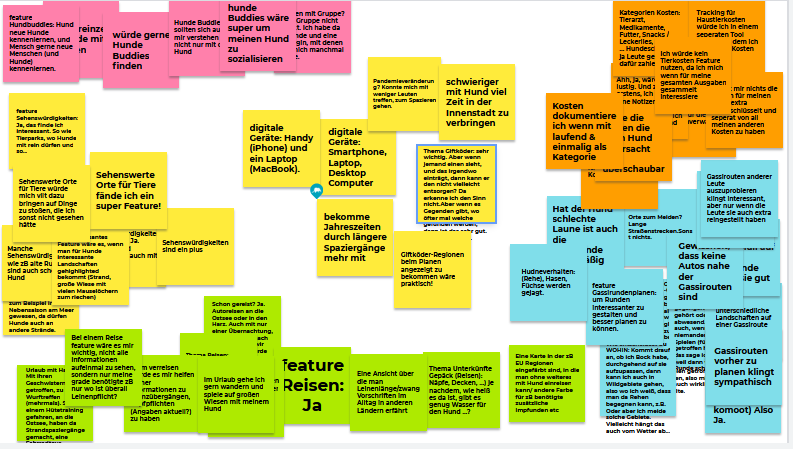
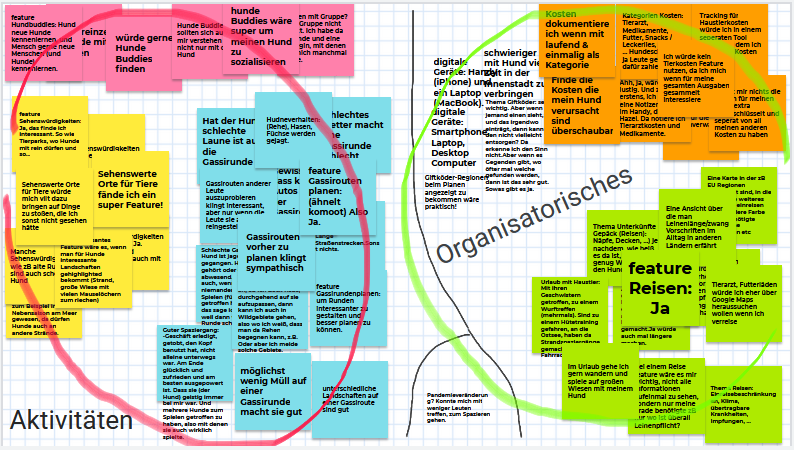
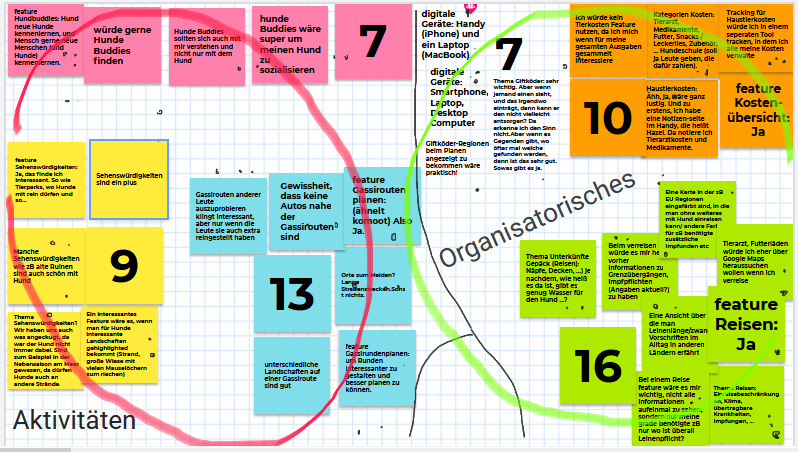
We sorted the responses into 4 major categories (gray/white) and 4 subcategories (colored). Unsurprisingly, the majority of participants responded that they Look up information when trying to form an opinion. The blue area contains participants that attempt to look up information of both sides of the story. This is our target group because they are willing to understand multiple viewpoints, but possibly lack easy access to websites across the political spectrum.
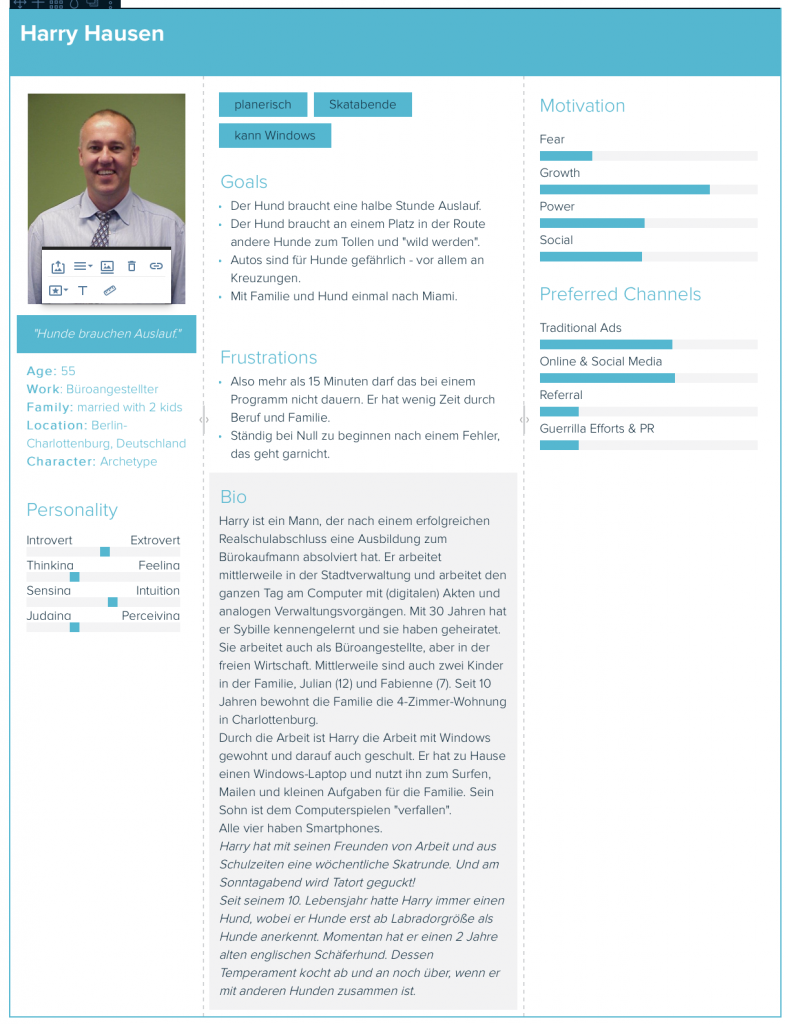
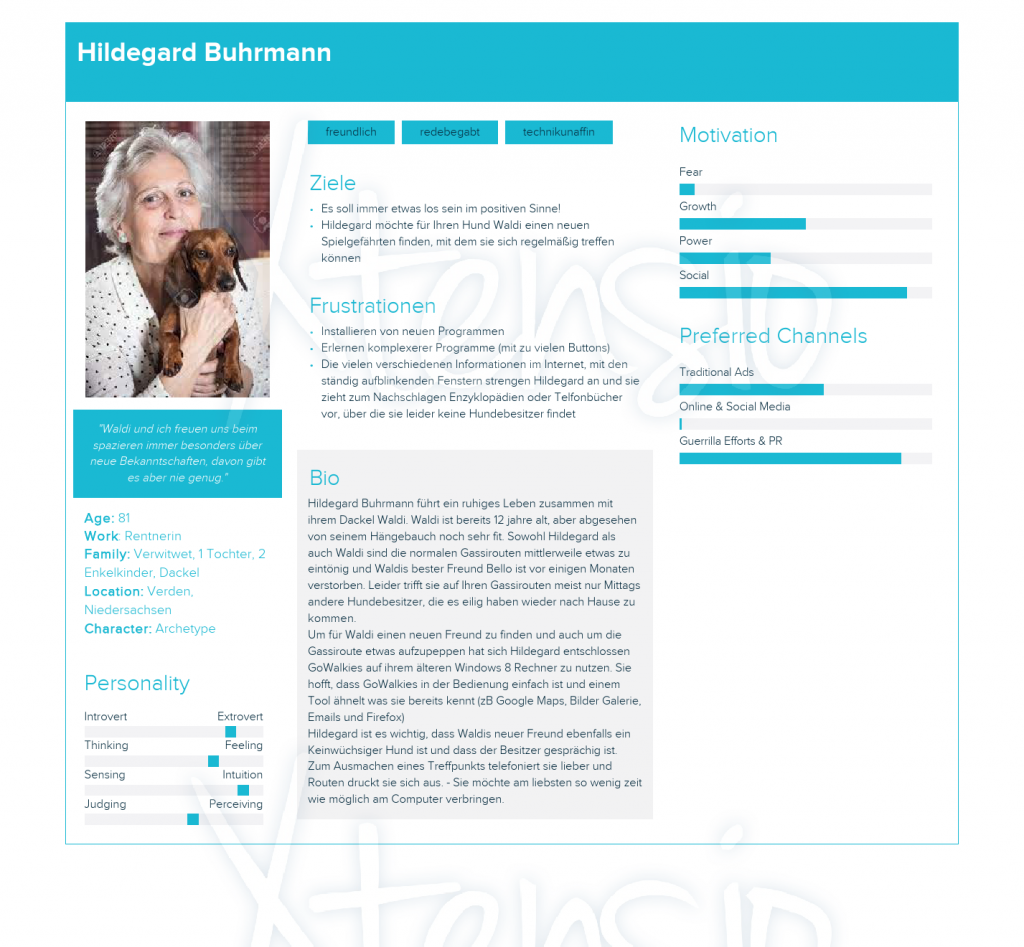
https://cdn.discordapp.com/attachments/834058821948276749/839150441895297038/HCI_-_3-2.jpg
Final state of the affinity diagram.

2. Primary Persona

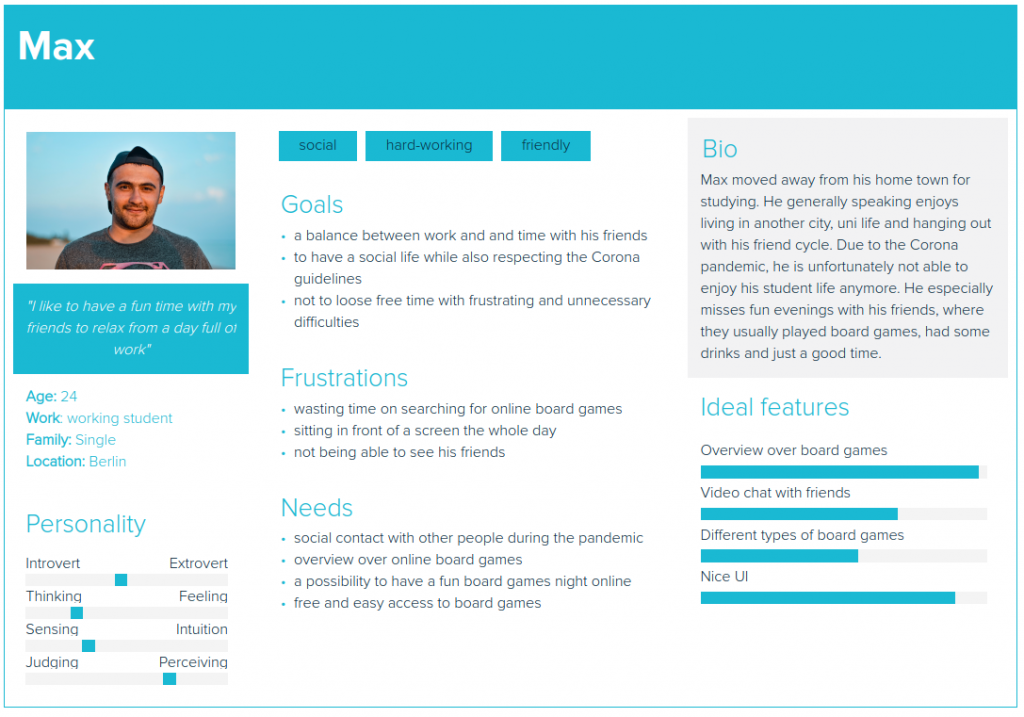
To form a primary persona we used the responses from our three interviews and the average response to our questionnaire. The majority of facts about the primary persona in the following picture is directly based on responses, e.g. favorite apps and age. The the remaining facts, such as curious or helpful, are simply invented and thought to be well fitting.

https://cdn.discordapp.com/attachments/834058821948276749/839932574091706388/Screenshot_2021-05-06_at_20.20.30.png
Primary persona.

3. Scenario

To create a scenario for our persona we used our entire dataset and came up with a story aligns with the primary persona and attempts to describe how application is supposed to be used. WHAT questions are printed in bold and WHERE/CONTEXT questions are printed in italic font.


Each work day when Mark commutes to university with public transportation, he quickly checks his Reddit feed for some minutes in between transfers. On his favorite subreddit, /de, he finds entertaining content. Many posts contain political content, often directly referencing news articles, and comments of other users. Mark wants to read about other perspectives off one post he deems opinionated. He uses the share button provided by Reddit to share the URL of the newsarticle with the app VERITAS. There, he gets an overview of other articles about the same topics. He can easily discern the political positions of the post on Reddit and other articles.
After a long day of studying, Mark is laying in his bed, about to sleep. He just wants to briefly check his Instagram before. He sees an interesting post about US politics liked by one of his friends. The post has some images with text describing a controversy about a US politician. He finds the information shocking and wants to read more about it. He uses VERITAS to loop up the topic he is concerned about and gets a collection of articles he can briefly skim over.
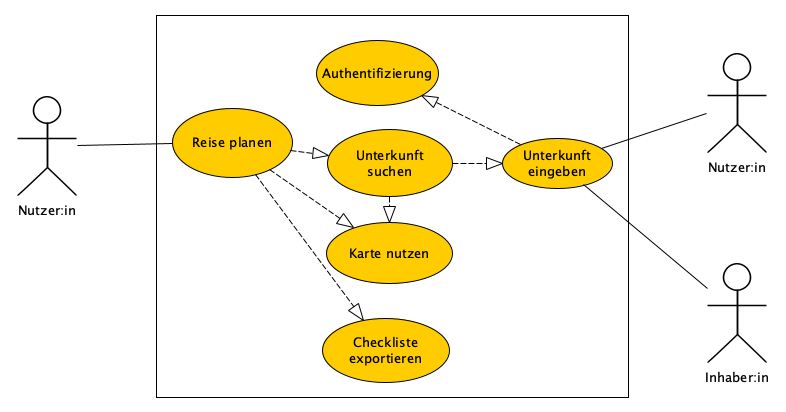
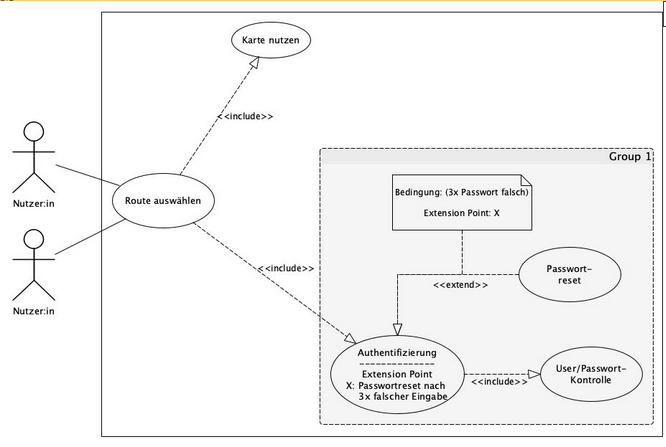

4. Two Use Cases

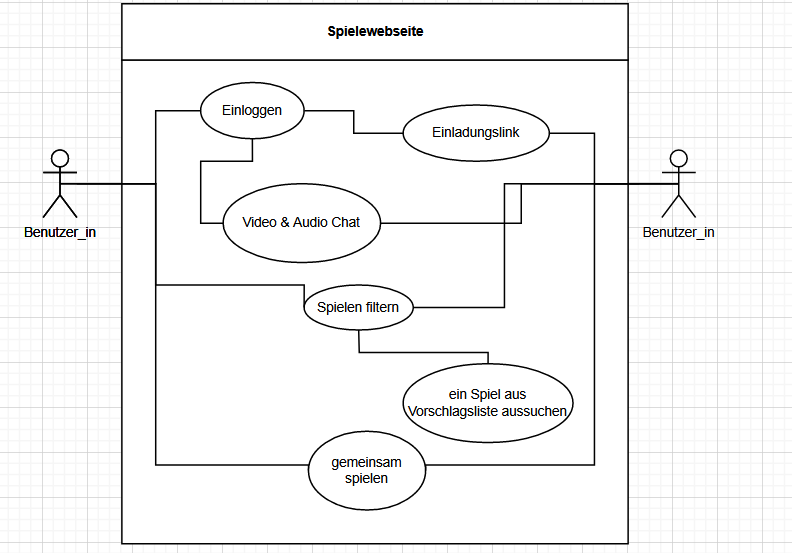
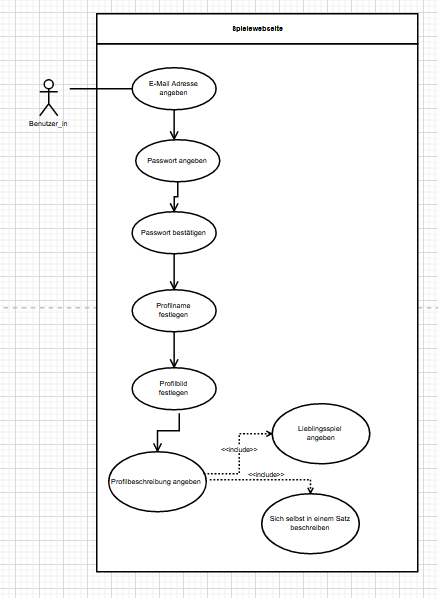
The following UML diagram depicts two use cases: (i) the administrator updating articles on the political spectrum and (ii) the potential user of VERITAS search, rating, and reading articles.

https://cdn.discordapp.com/attachments/834058821948276749/839935784185495603/Veritas_UML.jpg
Two use cases for our potential user and the administrator of VERITAS.

Reflection

Who did what?

First, we sat together to discuss the results of the interviews and questionnaires. After we selected the responses to put in the affinity diagram we categorized them. After that we split the tasks between us: Arne worked on the primary persona, Daniel wrote the scenario, Mateusz created the use cases, and Clemens put everything together in a polished blog post.

What did you learn?

We were excited to learn about affinity diagrams. Although initially skeptic about its scalability and usefulness, we soon found it to be useful and quickly got a nice overview of the responses.

[A#3, P8] Conceptual Model for User & Contect

Tasks

1. Affinity Diagramming

Original

The picture shows you the initial unsorted result of data collection from the user interview.

1st Iteration

After the first iteration the clusters of ideas are created. The ideas with related content are grouped together.

2nd Iteration

Headlines are created for each group, which describes what the user ideas are about.

3rd Iteration

Superheadlines are created for inter-related subgroups, which reflect the idea categories.

4th Iteration

We settled the Priority for each category, to show which user needs/expectations are our primary tasks.

All diagrams are created using Google Jamboard as a collaboration tool.

2. Primary Persona

The Persona is created using a free version of online tool xtensio with provided template. The photo of Max is downloaded from Unsplash, where provides freely-usable images.
Accessed at 14:05, 4.May 2021.

3. Create a Scenario

Color code: what & where

Freitag Abend möchte Max sich, wie vor Coronazeiten auch, mit seinen Freund_innen treffen, um einen entspannten Abend zusammen zu haben. Dafür setzt er sich in seinem Zimmer vor seinen Computer und loggt sich auf der Spielewebseite ein. Er klickt auf die Gruppe, die er zusammen mit seinen Freund_innen hat. Aimee hat keinen eigenen Account auf der Spielewebseite, weshalb ihr Max eine Link zuschickt, mit welchem sie auf die Gruppe zugreifen kann. Hier startet er den Videochat mit ihnen.

Nachdem sie für ein Viertelstündchen ein bischen gequatscht haben, wollen sie anfange zu spielen. Was genau, wissen sie noch nicht. Max würde aber gerne mit einem recht kurzen Spiel einsteigen, eine andere Person aus der Gruppe möchte ein Brettspiel spielen, eine weitere ein Logikspiel spielen. Sie geben ihre Kriterien in dem Vorschlag-system der Webseite ein, indem sie entsprechende Filter auswählen. Es wird ihnen eine Liste von Spielevorschlägen angezeigt. Nachdem sie sich die Kurzbeschreibung der ersten fünf Spiele angesehen haben, entscheiden sie sich für das 3. Sie klicken es an und beginnen direkt das eingebettete Spiel auf der Webseite. Sie kommunizieren weiterhin per Audio und Video. Joachims Mikrofon ist leider kaputt, deshalb kommuniziert er per Chat und Video. Nachdem sie das Spiel fertig gespielt haben, spielen sie nach dem gleichen Prinzip noch viele weitere Spiele an dem Abend, sodass Max und seine Freund_innen einen lustigen remote Spieleabend zusammen haben.

4. Two Use Cases with UML

First use cases describes the user interaction with our application for a normal social gaming night.
The second use case describes the user-application interactions for a typical registration process.

Both use cases are generated using online free tool diagrams.net.

Reflexion

Who made what contribution?

We generally did everything together in the group with twice meetings in the week. Ina prepared the documentation from her interview with friend and shared on Tuesday in the group meeting. The bulletpoints noted by Ina then are gathered unsorted in the diagram. All group members are participated in the initial gathering of ideas and further iterations. The final version with priority points as well as superheadlines is refined by Ina and Brendan.

The Persona is also created during group meeting. The main part is finished based on group discussion based on previous data analysis using affinity diagramming. Small refinements afterwards and looking for photo are done by Ina and Xin.

In our second meeting on Friday, the use cases are finished within group discussion. Ina mainly focuses on the registration process whereas Brendan and Xin focus on the social gaming process. The blogpost is then written by Xin with support from Ina and Brendan.

Learning & Take-Aways

The Interpretation of qualitative data can somehow be ambiguous since even though in our group, people have different perceptions of the qualitative data. Therefore, a sufficient and efficient communication as well as opinions exchange is really import. Otherwise, the gathered user data cannot be precisely or even correctly represented by us als developers.

With persona we learned how to depict a „typical“ user image for our product. By using the online template provided by Xtensio, we see some sections which are less relative to our project (or: we currently cannot really see /uderstand the necessity for our project) auch as personalities. We somehow also have the feeling that some descriptions are inituitiv and subjective, since an „absolut covergence“ from user data is alway hard to find.

What went well?

Everything went well. We see our weekly progress as positiv.

Improvement and Concern

We got some really use ideas from our potential users, but some the cutomer wishes are hard to implement. For this case, we are unsure whether we need to considerate the person as secondary potential user, or should we take the suggestion as important feature which we ignored to garantee. Maybe some functions proposed by users require advanced technologies which we are not sure whether it is able to implement in our application. Some user wishes seem to be hard to realize based on our product format (web application).

Another confusion is that we are not sure whether our data gathering method will trigger bias, since either interviewee or survey participants are in our „connected cycle“.

[A#6, P3] Conceptual Model for User & Context

Aufgaben

1. Summarize affinity diagramming

erste Sammlung aller Notizzettel
Gruppierungen erstmal nach den Unterteilungen des Interviews, der einzelnen Funktionen: Hundebuddies, Kosten, Reisen, Sehenswürdigkeiten, Gassiplaner, Rest: digitale Geräte, Situationsveränderungen, …
Überkategorien: Aktivitäten & Organisatorisches
Wir haben priorisiert nach für uns wichtigen Informationen. Anscheinend gibt es mehr Denkbedarf zum Reisefeature als gedacht.
Hier sind die Antworten auf eine Frage in unserer Umfrage, die wir dann kategorisiert und ausgezählt haben. So haben wir später Priorisierungen für die Features, die wir zudem mit den Interviews korrelieren (Affinity Diagramm).

Insgesamt haben wir 12 Datenblätter.

2. Derive a primary persona from your data-gathering insights

Quelle: https://www.harrystock.com, 06.05.2021, 17:30

3. Derive an extreme character from your data-gathering insights

Quelle: https://creativemarket.com/huertas19/414004-Portrait-of-a-happy-senior-woman-wit-stock-photo-containing-elder-and-people, 06.05.2021, 17:30

4. Create a scenario

Szenario

Folgend ist was blau markiert und wo grün.

Endlich ist Wochenende. Maria hat sich freigenommen, um viel Zeit mit ihrem Dalmatiner Rosa zu verbringen. Kaum ist sie am Samstagmorgen erwacht, wird ihr auch schon das Gesicht abgeschleckt. Die Sonne scheint, die erste warmen Tage werden im Radio angekündigt. Maria sitzt schon während der Hund sein Frühstück verputzt, in der Küche am Laptop und überlegt, wo sie heute ihren langen Spaziergang macht. Am Sonntag hat sie sich mit einer Freundin, die auch einen Hund besitzt verabredet, um zusammen an einem entlegeneren Ort, spazieren zu gehen. Heute jedoch, genießt sie die Zeit alleine mit Rosa. Sie kennt alle Spazierwege in der Umgebung und versucht, zu ahnen, wo und wann sie Rosas Hundefreunde am ehesten treffen könnte. Maria entscheidet sich am Vormittag eine kleine Runde zu drehen, wo sie oft Rosas beste Freunde trifft und am Nachmittag eine große Runde, mit Abstechern auf noch unbekannte Wege, um vielleicht auch neue Hunde und Menschen kennenzulernen

Leider trifft sie auf dem kleinen Spaziergang nur Spaziergänger ohne Hunde. Aber am See am Nachmittag trifft sie zufällig verschiedene Hund(-besitzer) und Rosa kann spielen.

5. Model two Use Cases with UML

Im ersten Use Case kann man erkennen, dass ein Nutzer eine Reise planen möchte. 
Das zweite Diagramm zeigt, wie ein/e NutzerIn eine Gassiroute auswählen möchte, in der sich ein/e anderer/e NutzerIn befindet (und sich geshared hat). Eine Authentifizierung ist hierbei genauer gezeigt.