[A#10, P7] Veritas – Evaluation and Project Description

(1) Evaluate your test results.

What method(s) did you use to evaluate the results of your usability tests?

We first wrote down all our notes. As there weren’t many notes (14 in total), we skipped all more complex evaluation methods and simply discussed all notes in the group. We also used a post-test questionnaire (UMUX) to get feedback from users after the test. The questionnaire consisted of questions regarding their feelings after first contact with the app. 


How did you evaluate the results?

We found main points that we all agreed on were relevant in terms of the conducted tests. Those issues were the most problematic for users during the tests. We used them to make final touches on our prototype. We also retrieved positive points to evaluate what went correctly and was met with approval from our users. From all information gathered we extracted the main takeaways and applied them in the prototype.

What did you learn from the testing?

  • Overall, users found the app very easy to use (all users surveyed ‘strongly agreed’ to that statement in the post-test survey) and one mentioned it was intuitive.
  • All surveyed users disagreed with the statement: Veritas is a frustrating experience
  • the info-button was not clickable, but only the text. Two users clicked solely on the button, though, and assumed that it didn’t work
  • One user criticized that the onboarding screen (how to use the app) didn’t show the current site and that they had the urge to skip it and jump right into it. This reminds us of heuristic evaluation: showing the system state is part of Nielsen’s heuristic.

Just speaking from usability in the narrow sense, we are fairly confident that the app was easy to use and well designed.

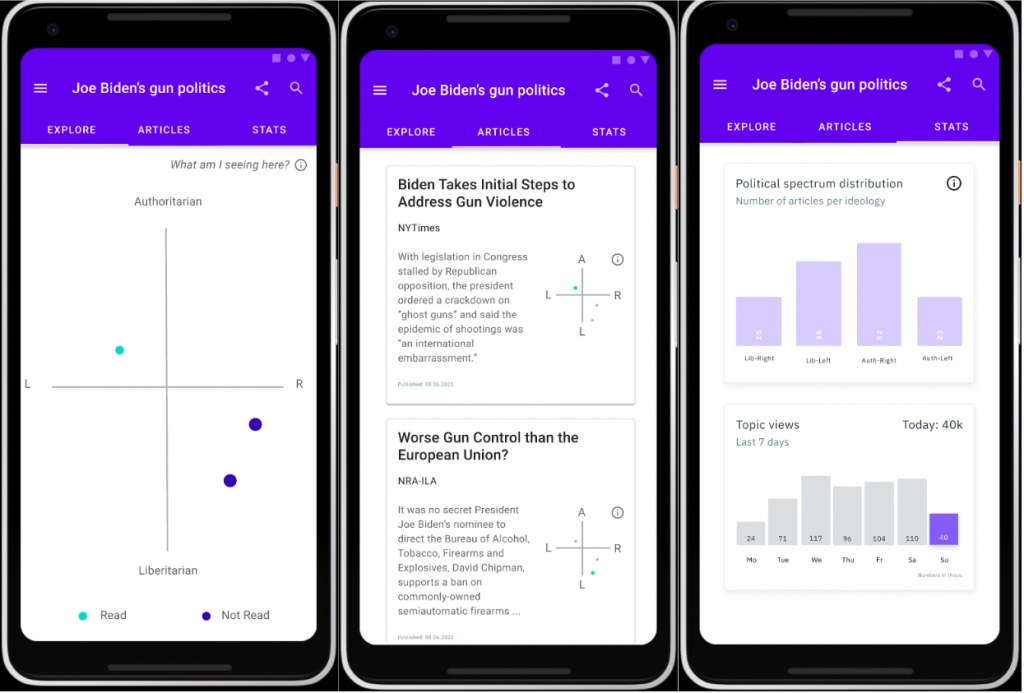
However, many users doubted the usefulness of the political compass. Many users wished for an explanation in regards to how articles are positioned. One user rejected the idea of the political compass altogether. Alternative solutions suggested were to show more “political dimensions” (in a radar chart). We feel that this would hinder the interpretability even more though. Still, one user explicitly and without us asking mentioned that they’d use the app. Another also said he would maybe use it. 

The testing itself was quite relaxed and the participants were well-informed in political topics and, as such, very interested in our app. This made for a good user group. The tasks didn’t quite fill their purpose. The users usually only worked for about 1 or two minutes per task. The thinking-aloud part was not done consistently. When asked about their opinion afterwards though, the users were eager to give additional feedback.

What are your main takeaways?

  • The political compass – our key feature in some sense – is controversial.
  • All participants questioned on which factors the articles get placed on the political compass. We should portray this information in our App.   
  • UX-wise we did a fairly good job 🙂

(2) Project description

Prototype:
Unique Part:

Name: Veritas – Escape your filter bubble today

Group Members: Arne, Clemens, Daniel, Mateusz

Project Description: Today’s news is often inherently biased and lacks nuanced journalism. Some more, such as breitbart news, and some less, such as reuters. With the recent surge of social media, a large share of unsuspecting readers fall into a so called filter bubble, i.e., they only see news of specific political backgrounds, which they are anticipated to like. Some think, this may lead to political extremism, further deepening preconceived opinions and ideas. 

Veritas is a tool that makes it easy for users to explore opinions and articles in all corners of the political spectrum. You give Veritas a topic and it presents you a large collection of articles on the given topic that cover a diverse set of published viewpoints.

Final Prototype: https://www.figma.com/proto/xqMeWV6kxUEShVbQSxePjD/THE-INVINCIBLE?node-id=167%3A178&scaling=scale-down&page-id=0%3A1

(3) Reflection

Who did what?

Arne, Daniel, and Mateusz evaluated the test results. Clemens wrote the project description and reflection.

What did we learn?

We learned about the Smartspider which is a different type of political compass.

What went well?

We split up the tasks well and everything was on time.

What can be improved?

When we have time, we consider improving our prototype further because it still lacks some realism.

[A#8, P7] Heuristic Evaluation

1) Continue to improve your high-fidelity prototype.

Our prototype was already almost ready to test. We only fixed a few errors and then called it done.

2) Conduct the first and second phases of a heuristic evaluation

Phase 1: Prepare

Phase 2: Evaluate (Individual Inspection)

The results of our individual evaluation are available here.

We tested the prototype of group Scenic Route and found violations in most categories. Most of the violations we found were of severity 3. We used the tasks from their assignment submission for our evaluation.

The descriptions of our violations and the Screenshots can be found at the bottom of the survey above.

We used screenshots-Chrome AddOn for screenshots.

A summary of important issues can be found here.

Reflection

Who made what contribution?

We discussed the tasks and Phase 1 together and the split up to do Phase 2 individually. Clemens wrote this blogpost.

What did you learn?

We improved our skills with Google Forms again and now know how to create multiple pages. It was also interesting to use the Figma prototypes of others as that gave us a better understanding on how we should adjust our prototype.

What went well?

Communication with the team again went well. Again, we are also happy with the direction that we are going to with the prototype and look forward to the feedback of other groups.

What would you like to improve?

We would like to improve the prototype further as it does not look as good as it could be.

Preattentive Processing

Humans do not only pick up information of their surrounding consciously. Pre-attentive processing is the process of collecting, filtering, and processing information subconsciously of our surroundings. This process is much faster than, and also precedes the conscious processing of information. Understanding this process is useful when trying to indirectly convey a message in a user interface.

Sources: Lecture and Wikipedia

[A#4, P7] Veritas – Ideation and Storyboard

Formulate a problem and hypothesis statement and document it.

Problem Statement

Mark needs a way to get a balanced overview on a specific topic because he would like to form an unbiased opinion. 

We will know this to be true when we see: can explore different sources for his opinion forming.

Hypothesis Statement

We believe that by building an intuitive overview site showing a range of news articles for Mark, we will double the diverse sources that Mark is using.

Conceptual models for task analysis

To create a conceptual model for the task analysis we opted for Hierarchical Task Analysis (HTA) because the tasks the user has to fulfill fit well into this format and we were already accustomed to this method.

https://cdn.discordapp.com/attachments/834058821948276749/842007298012741632/Sitemap_-_Frame_1.jpg

Find inspirations, analogies, and create a moodboard.

Next, we each worked 30 mins individually to find inspirations and envision what theme our application is supposed to have. Additionally, we look at other solutions out there and thought about how we can differentiate us from existing projects. We opted for simplicity and usability as main focus since this is what is lacking most on similar websites.

https://cdn.discordapp.com/attachments/834058821948276749/842019005766434856/dubidu_-_Frame_1.jpg

Create individual sketches.

After discussing our individual moonboards we again split up and tried to think of how the application should look like.

https://cdn.discordapp.com/attachments/834058821948276749/842658660673257472/2021-05-14-Note-09-03.png
https://cdn.discordapp.com/attachments/834058821948276749/842666485988982805/IMG_20210513_225335.jpg
https://cdn.discordapp.com/attachments/834058821948276749/842666488016011305/20210514_093424.jpg

Condense your results from the previous step into a storyboard.

After presenting the design to each other we decided to integrate the best of everything into our solution. The descriptions below the individual pictures describe the idea in detail.

https://cdn.discordapp.com/attachments/834058821948276749/843476600602361866/20210516_151319.jpg

Reflection

Who did what?

We did task 1 and 2 together as a group. We split and did task three individually and then discussed our individual results again as a group. Next, we split up again to do the individual sketches and later decided as a group how we want out application to look like. Arne then merged our ideas and what we discussed into one big, nice sketch. Clemens wrote the blog post.

What did we learn?

We learned how one can merge the vision of multiple people into one core idea and how we can create one UI where the ideas of everyone are somehow represented.

What went well?

The discussion as a group usually works very well. Everyone gets to share their opinion and we are usually all happy with the result. Also, everyone does their work on-time and with good enough quality such that we can focus on further steps when we meet again.

Where is room to improve?

We are sometimes not a punctual to our meetings as we could be.

[A#3, P7] Veritas – Conceptual Model

In the previous week we interviewed three students in our target group and conducted a public survey to get an overview on how the general public forms their opinion on political topics.

In total we received 122 responses to our questionnaire, of which 61% are male and 56% are students. Most of the participants (78%) are younger than 36 years.

1. Affinity Diagramming

Our questionnaire consists of 15 questions, including 13 multiple-choice questions and two text-field questions. We used the responses to the question What are your usual steps when trying to form an opinion on a controversial topic? as input for our affinity diagram because it received the most qualitative answers.

We used miro.com to sort through and categorize the responses. The below image shows the initial state of the diagram.

https://cdn.discordapp.com/attachments/834058821948276749/839150273712226334/Screen_Shot_2021-05-04_at_16.18.31.png
Initial state of the affinity diagram.

We sorted the responses into 4 major categories (gray/white) and 4 subcategories (colored). Unsurprisingly, the majority of participants responded that they Look up information when trying to form an opinion. The blue area contains participants that attempt to look up information of both sides of the story. This is our target group because they are willing to understand multiple viewpoints, but possibly lack easy access to websites across the political spectrum.

https://cdn.discordapp.com/attachments/834058821948276749/839150441895297038/HCI_-_3-2.jpg
Final state of the affinity diagram.

2. Primary Persona

To form a primary persona we used the responses from our three interviews and the average response to our questionnaire. The majority of facts about the primary persona in the following picture is directly based on responses, e.g. favorite apps and age. The the remaining facts, such as curious or helpful, are simply invented and thought to be well fitting.

https://cdn.discordapp.com/attachments/834058821948276749/839932574091706388/Screenshot_2021-05-06_at_20.20.30.png
Primary persona.

3. Scenario

To create a scenario for our persona we used our entire dataset and came up with a story aligns with the primary persona and attempts to describe how application is supposed to be used. WHAT questions are printed in bold and WHERE/CONTEXT questions are printed in italic font.


Each work day when Mark commutes to university with public transportation, he quickly checks his Reddit feed for some minutes in between transfers. On his favorite subreddit, /de, he finds entertaining content. Many posts contain political content, often directly referencing news articles, and comments of other users. Mark wants to read about other perspectives off one post he deems opinionated. He uses the share button provided by Reddit to share the URL of the newsarticle with the app VERITAS. There, he gets an overview of other articles about the same topics. He can easily discern the political positions of the post on Reddit and other articles.
After a long day of studying, Mark is laying in his bed, about to sleep. He just wants to briefly check his Instagram before. He sees an interesting post about US politics liked by one of his friends. The post has some images with text describing a controversy about a US politician. He finds the information shocking and wants to read more about it. He uses VERITAS to loop up the topic he is concerned about and gets a collection of articles he can briefly skim over.


4. Two Use Cases

The following UML diagram depicts two use cases: (i) the administrator updating articles on the political spectrum and (ii) the potential user of VERITAS search, rating, and reading articles.

https://cdn.discordapp.com/attachments/834058821948276749/839935784185495603/Veritas_UML.jpg
Two use cases for our potential user and the administrator of VERITAS.

Reflection

Who did what?

First, we sat together to discuss the results of the interviews and questionnaires. After we selected the responses to put in the affinity diagram we categorized them. After that we split the tasks between us: Arne worked on the primary persona, Daniel wrote the scenario, Mateusz created the use cases, and Clemens put everything together in a polished blog post.

What did you learn?

We were excited to learn about affinity diagrams. Although initially skeptic about its scalability and usefulness, we soon found it to be useful and quickly got a nice overview of the responses.