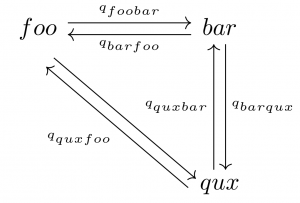
Tricky at first, but immensely helpful.
As I become more familiar with Latex, I realize how efficient this markup language is for generating publication-quality diagrams and figures. For a commutative diagram displaying the transition rates of plant leaf shapes, the following Latex code suffices to generate a clear and succinct graph.
\documentclass[]{standalone}

\usepackage{tikz-cd}

\begin{document}

\tikzcdset{every label/.append style = {font = \tiny}}

\begin{tikzcd}[row sep=50, column sep=50]

foo \arrow[r, shift left, "q_{foobar}"]

\arrow[r, <-, shift right, swap, "q_{barfoo}"]

\arrow[dr, shift right=2]

& bar \arrow[d, shift left,"q_{barqux}"] \\

& qux \arrow[u, shift left, "q_{quxbar}"]

\arrow[ul, shift left=4, "q_{quxfoo}"]

\end{tikzcd}

\end{document}


 Die
Die