[A#3, P4] Conceptual Model for User & Context

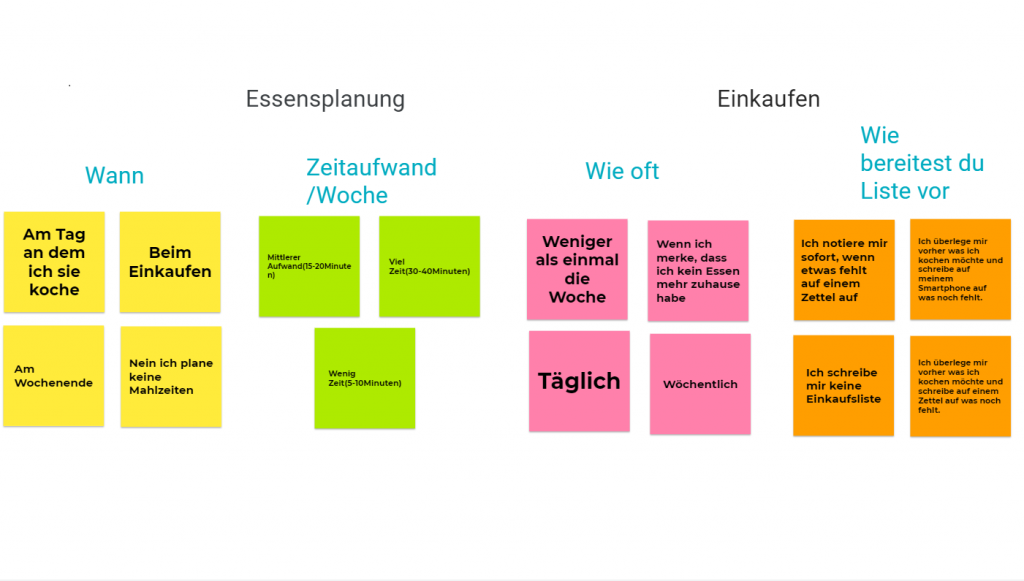
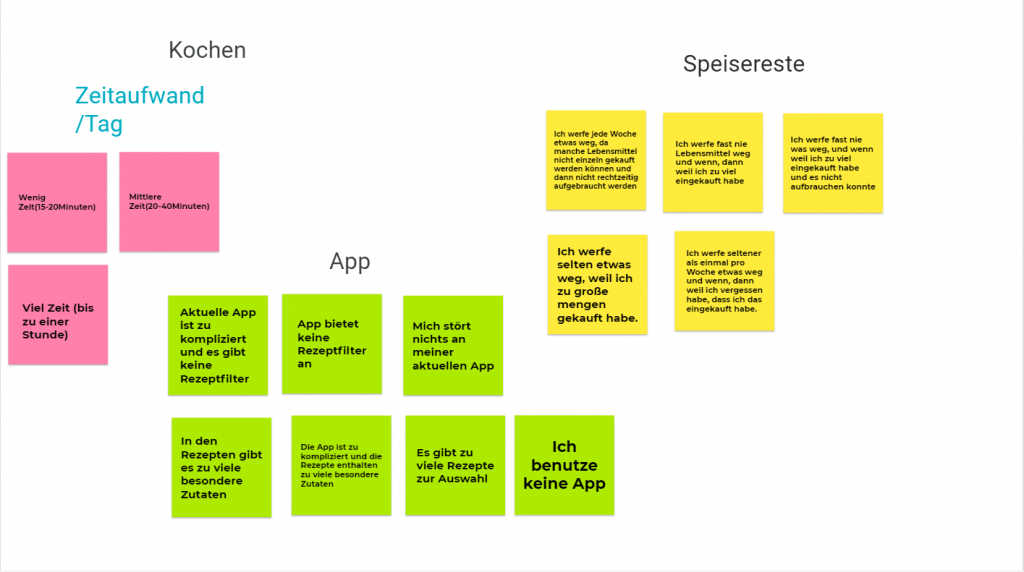
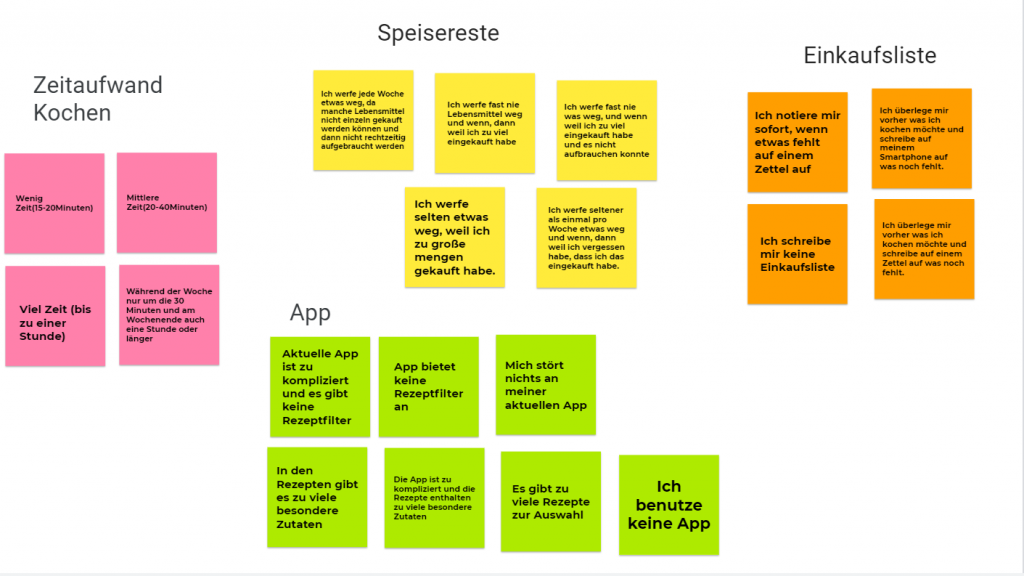
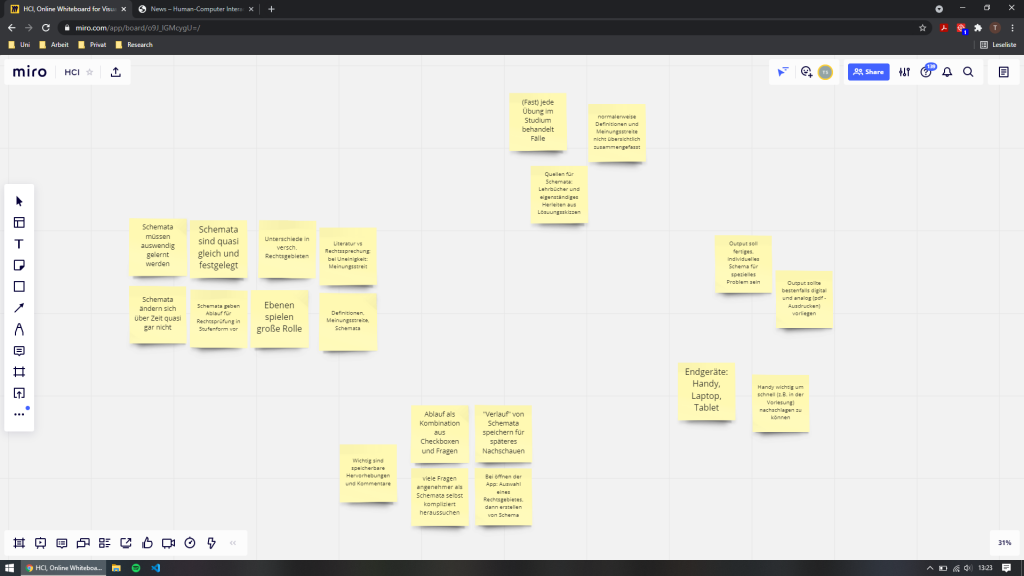
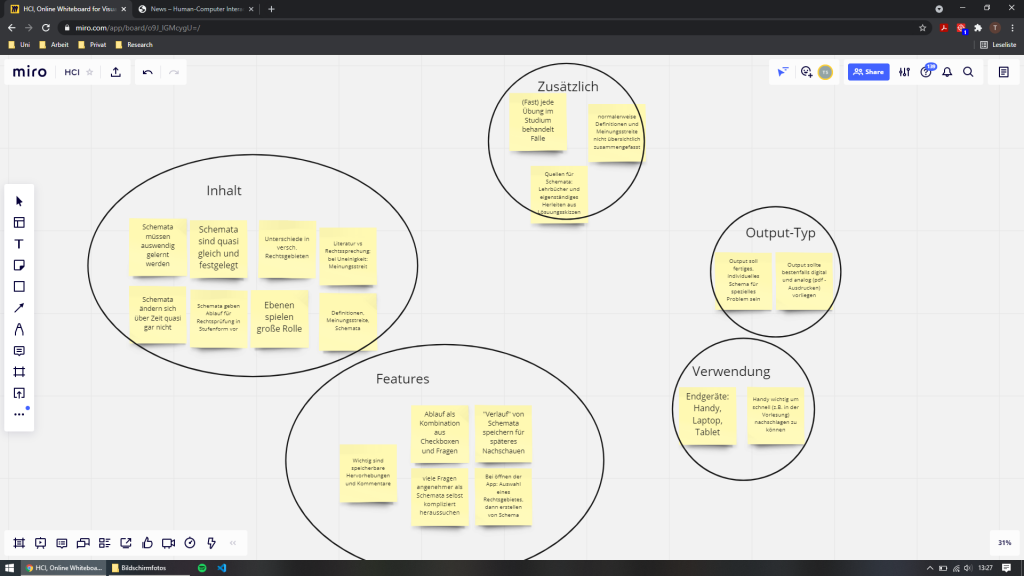
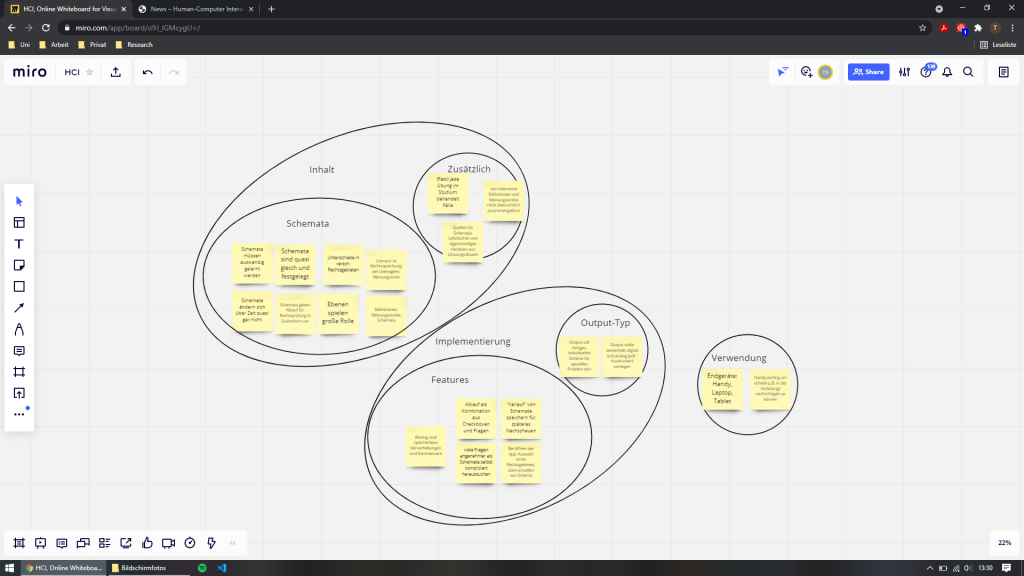
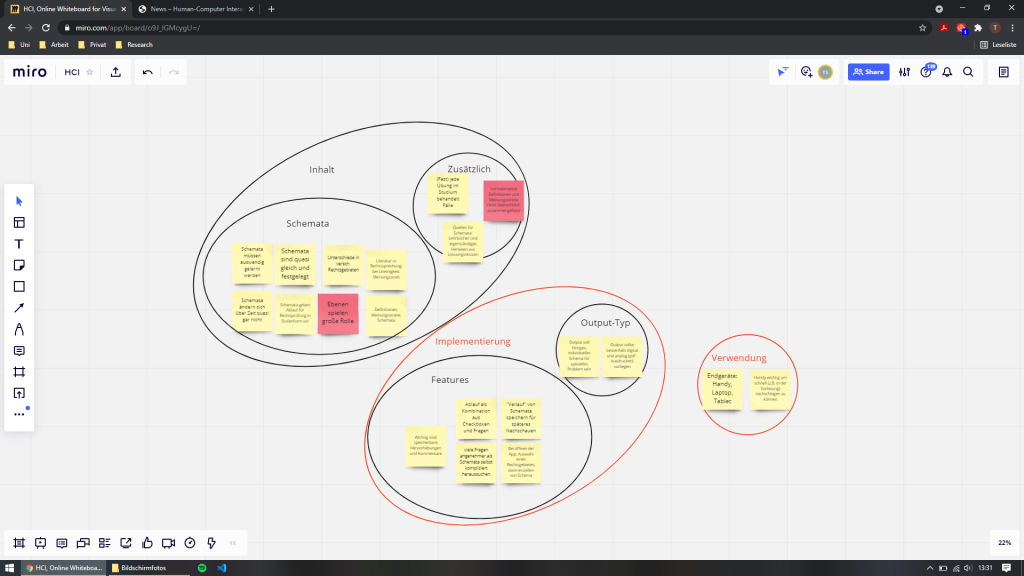
Analyze your (qualitative) data using affinity diagramming

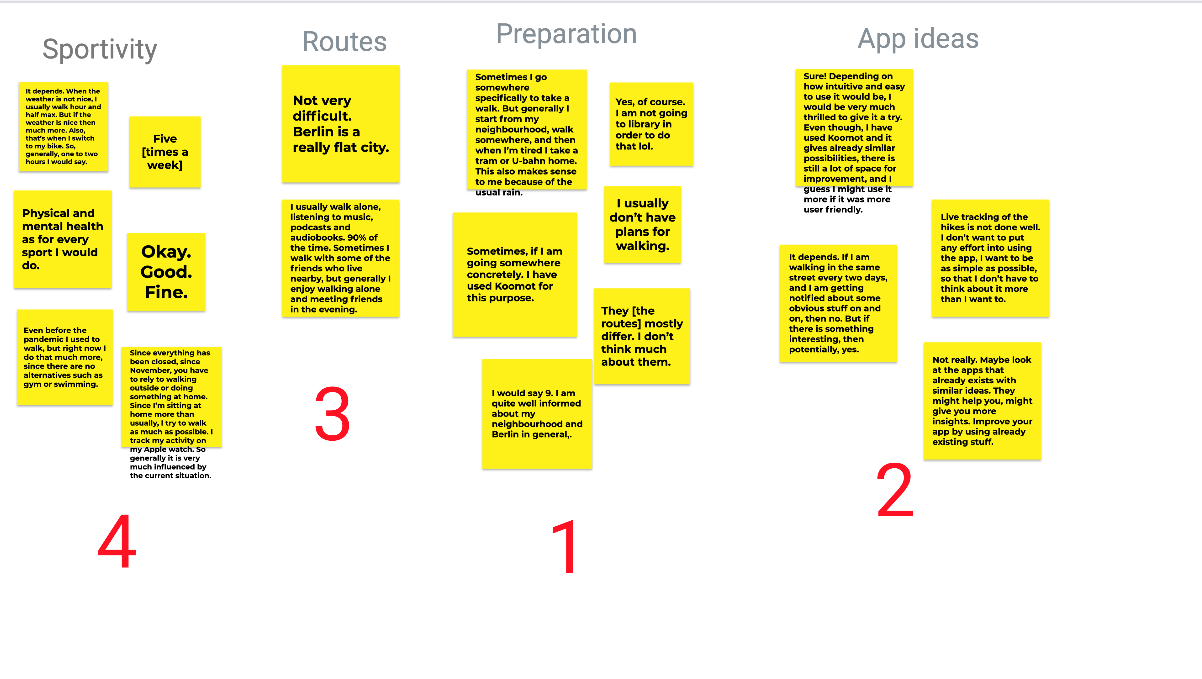
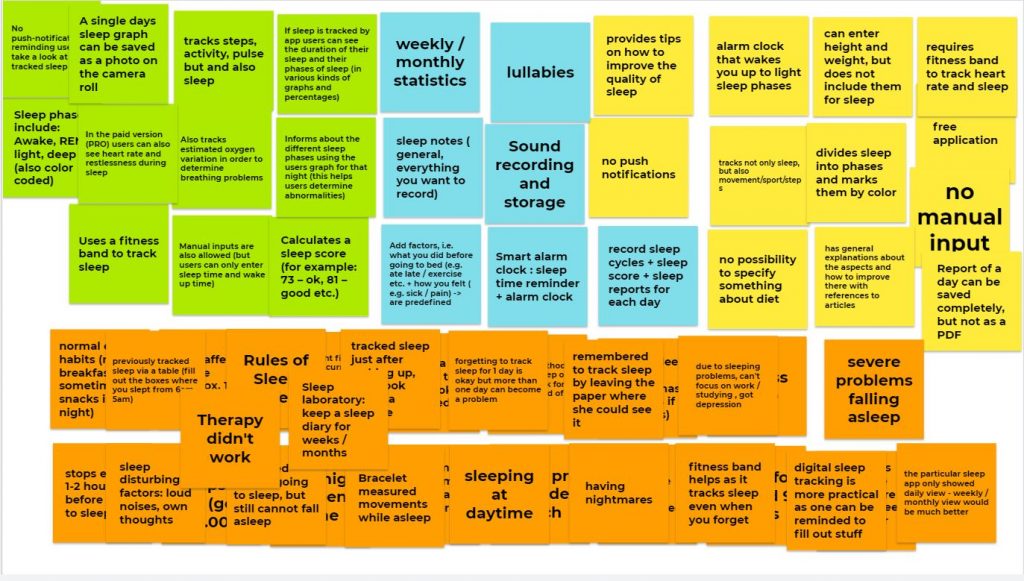
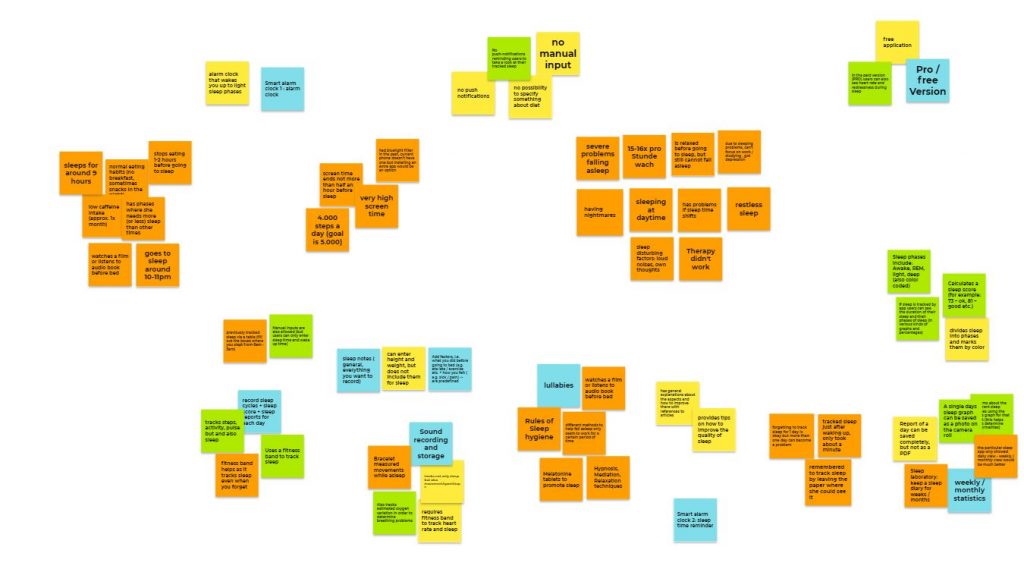
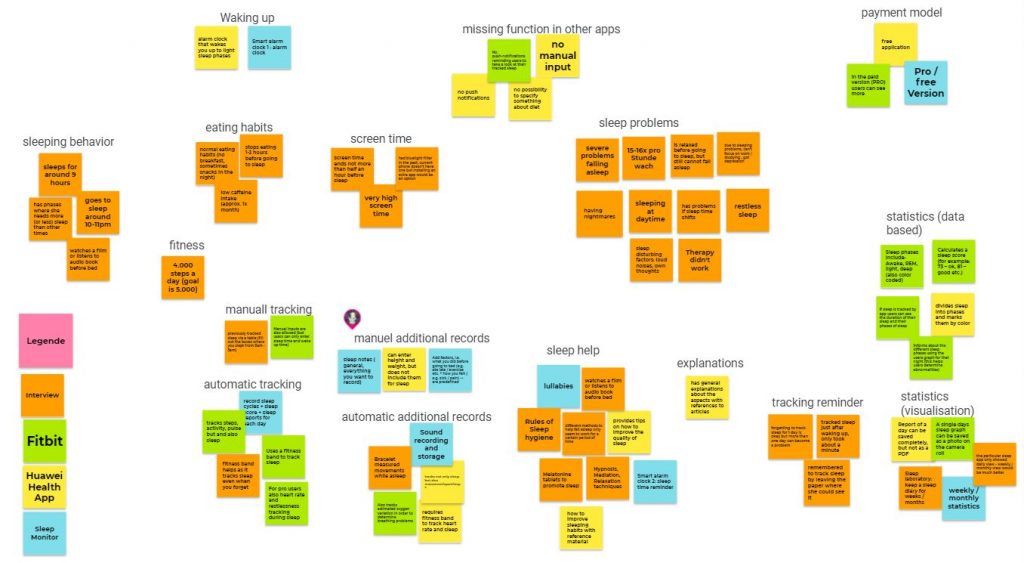
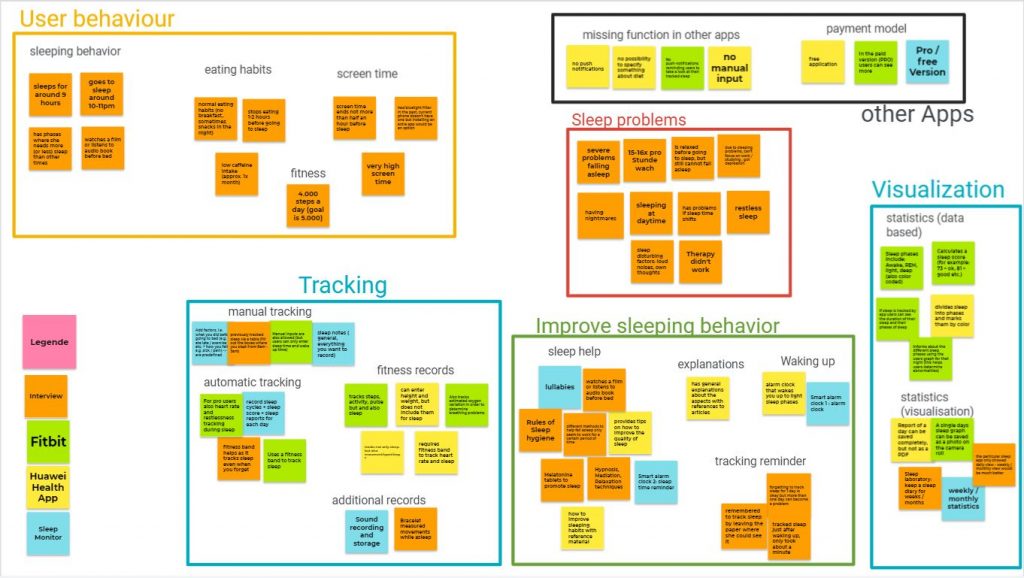
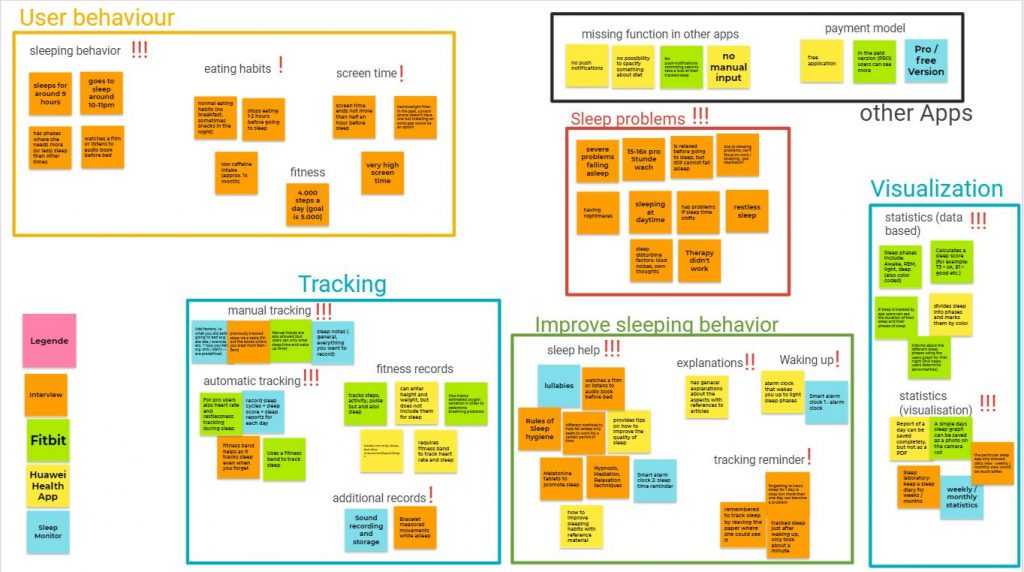
Im Folgenden sehen Sie die in der Übung beschriebenen Schritte zum Affinity Diagramming. Der erste Schritt (alle Notizen auf einzelne Punkte aufteilen) wurde dabei nicht extra dokumentiert. Die Priorisierung im letzten Schritt ist durch eine Hervorhebung in Rot dargestellt. Wir finden die Erkenntnisse zur Implementierung (i.e. Features und Output), sowie zur geplanten Verwendung durch den User am wichtigsten. Allerdings sind die beiden rot markierten Inhalte über Schemata und Zusätzliches ebenfalls als wichtig erachtet worden, weshalb wir diese gesondert hervorgehoben haben.

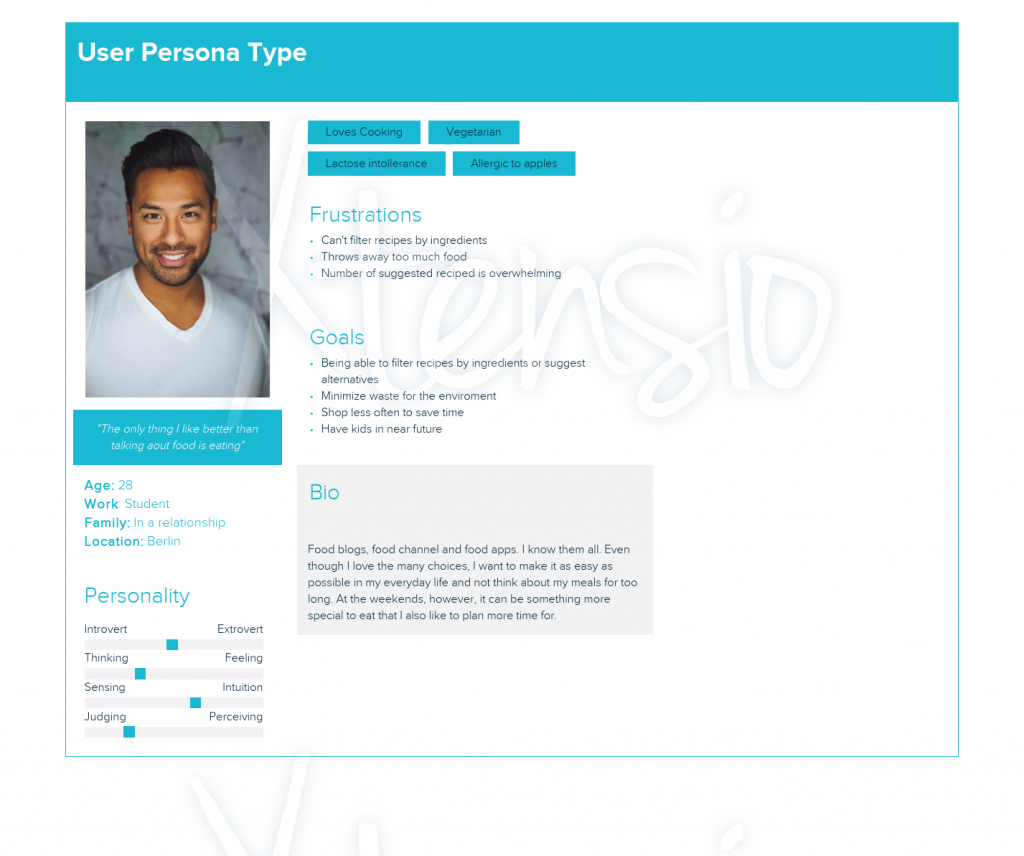
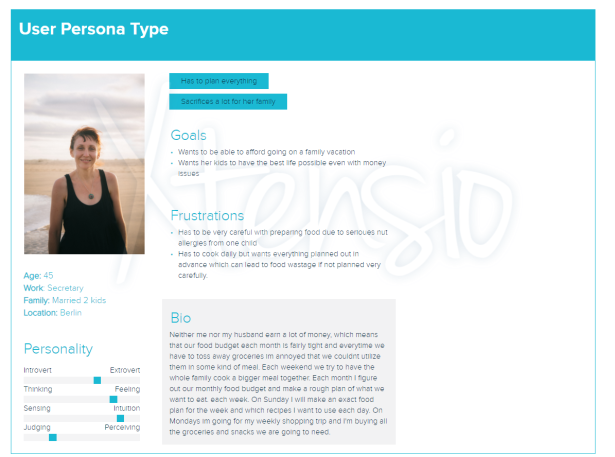
Derive a primary persona from your data-gathering insights

Hier sehen Sie die von uns erstellte Persona „Jura Yun“. Wenngleich auffällt, dass wir bei der Erstellung viel Spaß hatten, hat uns das Erstellen der Persona die Wichtigkeit einer strukturierten Darstellung stark verdeutlicht. Man bekommt ein Gefühl dafür, dass Jura als Fach sehr unübersichtlich ist und dadurch ein hohes Maß an Strukturierung fordert. Andernfalls könnte die Persona (i.e. der User) später leicht überfordert sein und die App wäre keine Erleichterung sondern im schlimmsten Fall sogar eine weitere Hürde im Lernprozess. Die Persona ist als PDF-Datei angehängt.

Create a scenario

Im Folgenden Szenario sind „what“ und „where“ in der hier gezeigten Art und Weise hervorgehoben.

Yun schaut auf sein Handy und weiß, dass gleich sein letzter Kurs vorüber ist. Nach der Uni begibt Yun sich in die Bibliothek um die Übung zum nächsten Termin fertig zu machen. Wie immer stört ihn seine schwere Tasche, die allerhand Schemata enthält. In der Bibliothek angekommen hält er nach einem freien Tisch Ausschau. An diesem Tisch sollte möglichst niemand sitzen, damit Yun seine verschiedenen Schemata ausbreiten kann. Das Suchen ist nervig und manchmal findet er keinen Platz. Heute hat er aber Glück und findet einen freien Tisch. Yun muss heute prüfen, ob der mutmaßliche Täter einen Mord oder nur Totschlag begangen hat. Dafür benötigt er die Schemata des Strafgesetzbuches. Das Schema für Totschlag findet er nicht in seinen Unterlagen. Deshalb muss Yun nun erst einmal im Internet nach diesem Schema suchen. Nachdem er das Schema gefunden hat, legt er sich schon einmal die weiteren Schemata parat, die er für die Prüfung auf Totschlag benötigt. Nachdem er diese Schemata parat gelegt hat, geht er alle diese Schemata durch und prüft, ob er noch weitere Schemata benötigt, damit er den Fall endgültig prüfen kann. Er bemerkt, dass er für eines dieser Schema noch zwei weitere Schemata prüfen muss. Nachdem er den Fall nun endlich geprüft hat, packt Yun seine Sachen zusammen. Weil er nicht weiß, welche Schemata er beim nächsten Mal benötigt, gibt es keine Ordnung in seiner Umhängetasche. Er denkt beim einpacken daran, wie er nächstes Mal wieder erst einmal die
Schemata suchen muss. Mit der Hoffnung, dass es irgendwann eine Lösung für diesen Papierberg, den er tagtäglich mit sich rumschleppen muss, gibt, geht er nach Hause.

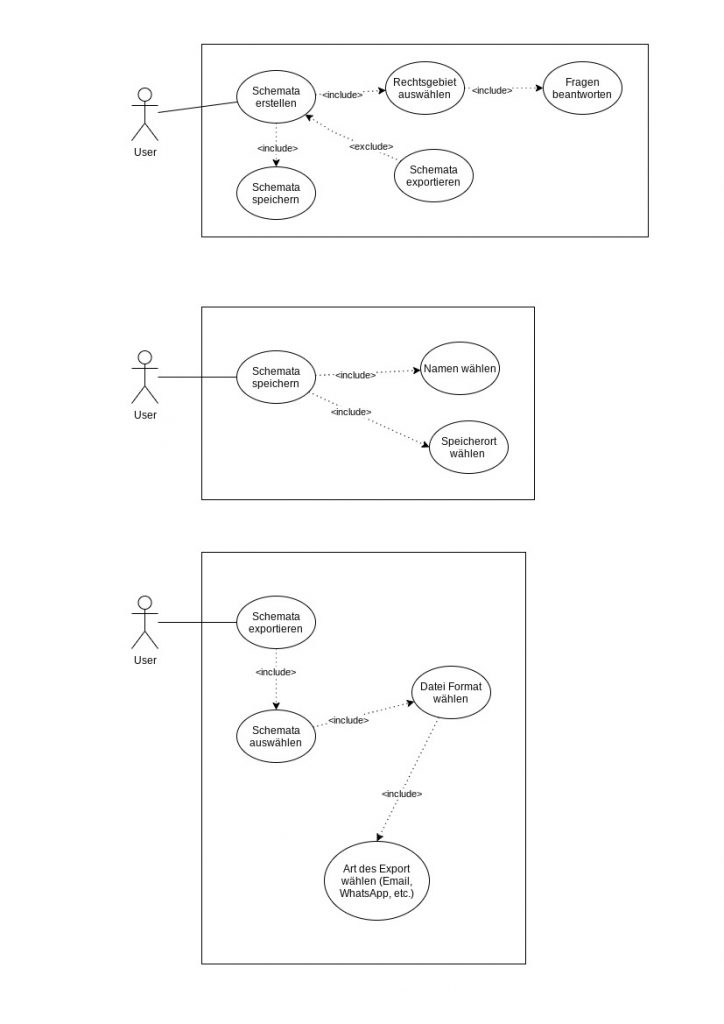
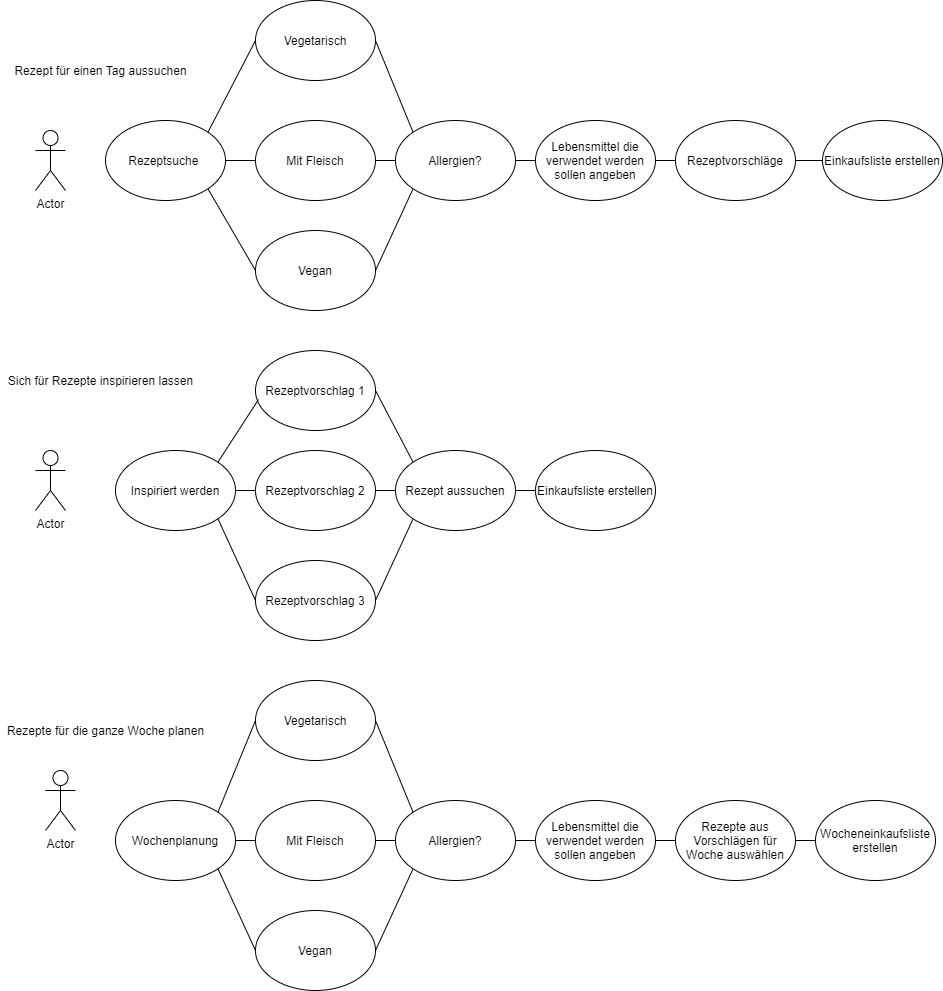
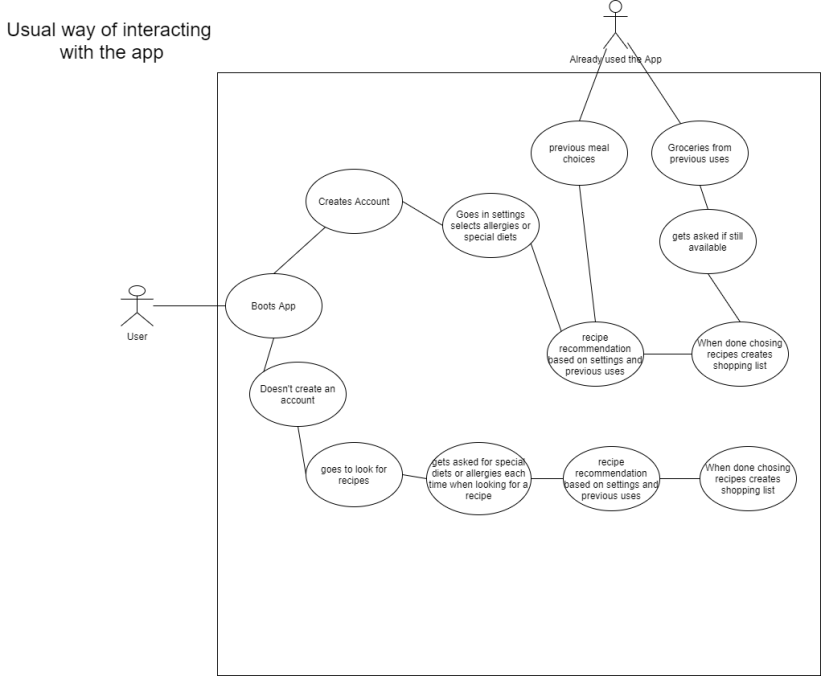
Model two use Cases with UML

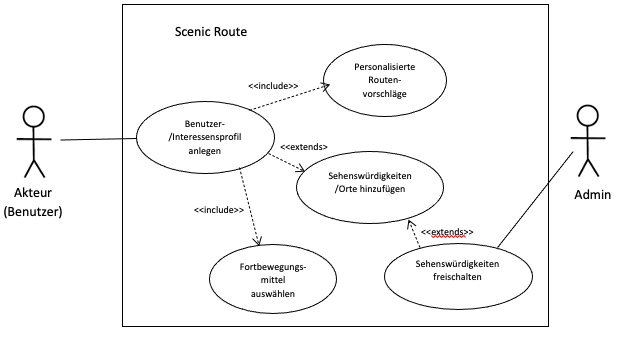
Hier sehen Sie die erstellten Use Case UML-Diagramme. Wir haben uns für die drei wichtigsten Aktionen der User entschieden. Das generieren von Schemata, das Exportieren der Schemata und das Speichern der Schemata.

[A#3, P2] Conceptual Model for User & Context

1. Affinity Diagramm

Our questionnair includes 23 questions out of five categories. The categories are „Food planning“, „Grocery shopping“, „Cooking“, „Leftovers“ and „App“. Since we already had this presorting we started our affinity diagramm by listing the given answers to the categories in different colors.

Answers to the categories „Food planning“ and „Grocery shopping“
Answers to categories „Cooking“, „Leftovers“ and „App“

Illustrating the answers with the different colors and headers helped us realizing, that we need to rethink which answers are really important for the diagramm. We cut out the time expenditure subheaders and were able to categorize the answers to four groups.

Affinity Diagramm with four categories.

2. Primary Persona

The primary persona is based on our semi-structured interview. The main features of this person is the love for food but also the struggle of finding recipes that fit to the food tolerance and the prioritized diet. The other struggle this persona has is to minimize his wasted leftovers and cooking ingredients.

(Image source „https://unsplash.com/photos/iFgRcqHznqg„)

3. Extreme Character

Our extreme persona is a mother of two. Money is short and she struggles to prevent her kids a healthy and balanced diet. Another challenge for her is the food intolerance of her child.

(Image source „https://unsplash.com/photos/AkGd_YB6Q2c“)

4. Scenario

Our scenario is based on the persona of task 3.

Every day Leroy wakes up and first thing in the morning is coffee and a slice of freshly baked bread. The bread is from a local bakery specialized on sourdough bread. His favourite.

After the coffein has started his effect he’s headed to his desk at home. Work calls. For the next 2-4 hours he will sit here and answer calls and do paper work.

Work is done and he slowly gets hungry again. The same question as every day comes to his mind „What’s for lunch„. He has some stuff in his fridge but isn’t exactly sure what to do with it. He starts searching on cooking websites for ideas. It takes him about 20 minutes until he found something he likes to eat (and doesn’t contain ingredients he is allergic to) on that day. The recipe doesn’t contain any ingredients of the things he already has at home so he has to go grocery shopping as he has to most days.

Next thing he does is writing a list for his grocery shopping. He writes it on his phone. The shopping trip will be fast, because he exactly knows what to buy and where to find it.

He’s still a bit exhausted after the workday and his shopping trip, but gladly he chose a recipe that will only take about 30 minutes with preparation. He cuts the vegetables, and puts half the brokkoli into the fridge. He will use it next time. (He didn’t use it next time. He threw it away a week later with half a lemon, a quarter onion and a green pepper that came in a package of 3 different colored peppers.)

The food tasted great and he emptied it on the same evening.

5. Use Case Diagramm

We decided to create four Use Case Diagrams. One for the case that someone just wants a recipe for the current day, one for the case that the person likes to get inspired (This is supposed to be daily changing recipe ideas) and one for the case that soemone wants to plan food for the whole week. The fourth diagramm shows the whole basic process with and without an account.

The first three Use Case diagrams show the process for users without a profile. If the user decides to create an account the filters don’t have to be specified every time. It will be saved in the settings chosen when creating the account.

[A#3, P4] Conceptual Model for User & Context

Affinity Diagramming

Step 1: Share Data

Step 2: Clustering

Step 3: Headlines

Steps 4 and 5: Super Headers and Priorities

Primary Persona

Melanie Mayer, 25 Jahre alt, Medizinstudentin


Sie ist bewegt sich gerne, ist aber keine Extremsportlerin. 
Wohnt seit einem Jahr in Berlin und geht mittlerweile dreimal die Woche spazieren, was allerdings durch Corona zugenommen hat. Dabei ist sie selten länger als eine Stunde unterwegs und die Routen, sind zum Teil auch der flachheit Berlins geschuldet, relativ einfach und nicht im besonderen anspruchsvoll.
Ihre Lieblingszeiten zum Spazierengehen sind die frühen Abendstunden.
In der Regel ist sie alleine unterwegs und hört dabei Musik. Um ihre Sicherheit macht sie sich dabei keine größeren Sorgen, trotz der Großstadt.
Sie liebt es neue Orte zu entdecken, wobei Sie sich allerdings nicht zuhause auf den Spaziergang vorbereitet, sondern die Route in der Regel aus einer Laune heraus entscheidet.
Sie kennt sich relativ gut in ihrer Umgebung aus, hat aber generell interesse daran, mehr über ihr Viertel/Stadtteil zu lernen und zu entdecken.
Sie benutzt bisher keine technischen Hilfsmittel für die Bestimmung ihrer Route, hat aber interesse daran auszuprobieren, ob dies ihren Spaziergang bereichern würde.
Der Spaziergang hilft ihr den Alltagsstress abzubauen und sie fühlt sich gesünder und fitter, wenn sie sich regelmäßig bewegt.

Extreme Character

Thomas Schneider, 29 Jahre alt, U-Bahnfahrer bei der BVG

Thomas kann, wenn er in Szenarien verwickelt wird, die ihn überfordern, oder wenn er unter zu viele Leute gerät Angstzustände entwickeln.
Aus diesem Grund verlässt er das Haus meistens nachts.
Seine Einkäufe erledeigt er am liebsten online, da für ihn ein Besuch im Supermarkt sehr belastend und anstrengend ist.
Trotzdem bewegt er sich gerne und geht beinahe jeden Tag nachts, in der Regel nach 11 Uhr, spazieren.
Am liebsten läuft er dann durch die Stadt und genießt die Stille.
Er ist der ersten dem auffällt, wenn in seiner Umgebung ein neues Haus gebaut wird oder ein neues Geschäfft eröffnet. Ihm fällt jegliche Veränderung auf.
Bevor er das Haus verlässt recherchiert er wo es neue Baustellen gibt oder ein Geschäfft neu eröffnet hat. Ihm ist es wichtig im Bezug auf seine Umgebung auf dem Laufenden zu bleiben. Desweiteren kennt er jegliche Gebäude seiner näheren Umgebung und weiß genauestens über deren Funktion bescheid.
Dies gibt ihm ein Gefühl der Sicherheit.

Scenario

Melanie steht morgens um 9 Uhr auf und stellt die Kaffeemaschine an, während sie duscht. Im Anschluss schaut Sie sich ihre heutige Online-Vorlesung an, während Sie frühstückt und ihren Kaffee trinkt.
Ihre arbeit für die Uni ist gegen 17 Uhr in der Regel erledigt und sie geht, nachdem sie sich eine halbe Stunde bei Youtube entspannt hat, spazieren.
Dafür nimmt sie ihre Kopfhörer, ihren Hausschlüssel, etwas Bargeld, aber nicht die ganze Brieftasche, und selbstverständlich ihre Maske mit.
Meistens zieht es sie in Richtung des nahegelegenen Parks, indem sie gerne spazieren geht. Auch die in der Nähe liegende Schrebergartenkolonie ist eine gern gewählte Anlaufstelle.
An dem heutigen, recht sonnigen, Tag wandert es sie allerdings ziellos durch die Straßen ihres Viertels, da sie sich nach etwas Abwechslung sehnt und auch ein wenig danach ein paar andere Gesichter zu sehen.
Sie nutzt den Spaziergang um sich bei einer nahe gelegenen Rösterei einen Kaffee zu holen und sich auf eine Bank zu setzen. Dabei hört sie ihren Lieblingspodcast.
Auf der gegenüberliegenden Straßenseite fällt ihr ein sehr schönes Gebäude auf. Sie vermutet es stammt aus der Renaissance ist sich aber nicht sicher. Das Gebäude sieht recht offiziell aus und sie fragt sich, ob es öffentliche genutzt wird. Sie probiert das Googeln kommt aber nicht weiter und bricht die Suche nach 3 Minuten ab.
Anschließend geht sie einen anderen Weg zurück nach hause und macht sich Abendessen.
Es gibt Nudeln mit einer selbstgemachten Tomatensoße a la Arrabiata.

UML Use Cases

Use Case 1: Routenvorschlag hinzufügen

Use Case 2: Routenplanung starten 

Assignment reflection

WHO MADE WHAT CONTRIBUTION?
We together conducted the Affinity Diagramming, defined persona and came up with a scenario. Marc and Sebastian also worked on the UML Diagramming while Milos finished the Blogpost as a whole.

WHAT DID YOU LEARN?
In this Assignment we dived deeper into our app ideas. While working we learnt how to practically implement personas and scenarios using the data we previously collected. We also have a better understanding now why such analysis make sense before jumping into coding.

WHAT WENT WELL?
We really liked doing that and found it quite interesting, because we had to think about actual usages of our application. Creating a persona went really good, so we decided to also create an extreme character as an additional element. 

WHAT WOULD YOU LIKE TO IMPROVE?
On the other hand, we did not find Affinity Diagramming quite useful neither for our quantitative survey nor for our qualitative interview data, because it was "too obvious". Probably larger amounts of data would be more senseful for such analysis. Other than that there is nothing we would like to improve specifically, since we are quite satisfied with out team flow and app idea.

[A#3, P5] Sleepy Heads – Conceptual Model for User & Context

Affinity Diagramming

For this task we used the website Google Jamboard
Here is an explanation for the different colours we used:

  1. Share Data
    At first we put each information on a sticky note and sorted them by the different data gathering method we used namely interview and markt analysis:

2. Clustering
Then we organzied them into different categories…

3. Headlines
…and gave them headlines:

4. Super Headlines
Then we discussed if we could combine some categories or not and gave
these new categories headlines too.

There you will see that some of our undercategories changed a bit due to our
constant discussions about the informations that we gathered.

5. Prioritize
In this final step we prioritized each category as to whether it is super
important for designing our mobile application or not.

[A#3, P7] Veritas – Conceptual Model

In the previous week we interviewed three students in our target group and conducted a public survey to get an overview on how the general public forms their opinion on political topics.

In total we received 122 responses to our questionnaire, of which 61% are male and 56% are students. Most of the participants (78%) are younger than 36 years.

1. Affinity Diagramming

Our questionnaire consists of 15 questions, including 13 multiple-choice questions and two text-field questions. We used the responses to the question What are your usual steps when trying to form an opinion on a controversial topic? as input for our affinity diagram because it received the most qualitative answers.

We used miro.com to sort through and categorize the responses. The below image shows the initial state of the diagram.

https://cdn.discordapp.com/attachments/834058821948276749/839150273712226334/Screen_Shot_2021-05-04_at_16.18.31.png
Initial state of the affinity diagram.

We sorted the responses into 4 major categories (gray/white) and 4 subcategories (colored). Unsurprisingly, the majority of participants responded that they Look up information when trying to form an opinion. The blue area contains participants that attempt to look up information of both sides of the story. This is our target group because they are willing to understand multiple viewpoints, but possibly lack easy access to websites across the political spectrum.

https://cdn.discordapp.com/attachments/834058821948276749/839150441895297038/HCI_-_3-2.jpg
Final state of the affinity diagram.

2. Primary Persona

To form a primary persona we used the responses from our three interviews and the average response to our questionnaire. The majority of facts about the primary persona in the following picture is directly based on responses, e.g. favorite apps and age. The the remaining facts, such as curious or helpful, are simply invented and thought to be well fitting.

https://cdn.discordapp.com/attachments/834058821948276749/839932574091706388/Screenshot_2021-05-06_at_20.20.30.png
Primary persona.

3. Scenario

To create a scenario for our persona we used our entire dataset and came up with a story aligns with the primary persona and attempts to describe how application is supposed to be used. WHAT questions are printed in bold and WHERE/CONTEXT questions are printed in italic font.


Each work day when Mark commutes to university with public transportation, he quickly checks his Reddit feed for some minutes in between transfers. On his favorite subreddit, /de, he finds entertaining content. Many posts contain political content, often directly referencing news articles, and comments of other users. Mark wants to read about other perspectives off one post he deems opinionated. He uses the share button provided by Reddit to share the URL of the newsarticle with the app VERITAS. There, he gets an overview of other articles about the same topics. He can easily discern the political positions of the post on Reddit and other articles.
After a long day of studying, Mark is laying in his bed, about to sleep. He just wants to briefly check his Instagram before. He sees an interesting post about US politics liked by one of his friends. The post has some images with text describing a controversy about a US politician. He finds the information shocking and wants to read more about it. He uses VERITAS to loop up the topic he is concerned about and gets a collection of articles he can briefly skim over.


4. Two Use Cases

The following UML diagram depicts two use cases: (i) the administrator updating articles on the political spectrum and (ii) the potential user of VERITAS search, rating, and reading articles.

https://cdn.discordapp.com/attachments/834058821948276749/839935784185495603/Veritas_UML.jpg
Two use cases for our potential user and the administrator of VERITAS.

Reflection

Who did what?

First, we sat together to discuss the results of the interviews and questionnaires. After we selected the responses to put in the affinity diagram we categorized them. After that we split the tasks between us: Arne worked on the primary persona, Daniel wrote the scenario, Mateusz created the use cases, and Clemens put everything together in a polished blog post.

What did you learn?

We were excited to learn about affinity diagrams. Although initially skeptic about its scalability and usefulness, we soon found it to be useful and quickly got a nice overview of the responses.

[A#3, P3] Data gathering

  1. Define the goals of your data gathering session.
    What do you want to find out?

    Find out if there is a need for this App. Get feedback from interviewees, get more ideas.
    Have deeper understanding of their current behaviour and what do they expect: how would this App improve their everyday interactions with physical activities and free time outside walks?
    How often would they use it?
    Could they picture themselves using the App?
    Do they feel insecure about using the App while walking?
    Would they like to have an offline mode which pre-saves some data in order to be able to use the app without internet?
  2. Based on your goal, derive the kind of people you want to gather data from.
    What are your participants?
    Walking enthusiasts, that are new to the city.
    Walking enthusiasts, that live here, but doesn’t know the city too well.

    Who are you interviewing?
    We will be interviewing one friend who lives in Berlin for a bit more than one year. He used to go to the gym regularly, but during lockdown his new favourite activity became daily hiking/walking around Berlin and sightseeing.
  3. Decide on your data gathering method.
    Which methods are you using and why?
    1. Interview
      An individual point of view is important and an interviewee might have some ideas on his/her own, what features are important for her.
    2. Questionnaire
      A good way to generate more data ones we know what are the most important topics that need to be acquainted.
  4. What type of interview (structured, unstructured, semi-structured)?
    1. Interview is semi-structured. 
    2. Questionnaire is semi-structured.
  5. What kind of data do you want to gather?
    We want to gather valuable information that would help us better understand needs and requirements the future users of our App might have. This we do via two methods: one in-depth interview with one person from our target group, but also a short quantitative survey which would be filled by another chunk of our desired user group.
  6. Decide how you handle the topics pilot study & data recording
    We would not record the interview, but rather write notes while we conduct the talk. The questionnaire will be an online formular which we will disseminate to our targeted group, so we will then have organized data in a table, for further analysis. 

Interview:

  • How would you describe the scope of your sporty everyday activities?
  • How would you describe your general health at this moment?
  • What is your motivation for walking? Why?
  • Who do you usually walk with?
  • Has your behaviour concerning walks changed during the pandemic?
  • What distances are you usually walking?
  • How often do you take a walk per week?
  • How difficult would you say the routes generally are?
  • How does your walking route usually look like? Do they always differ?
  • Do you listen to music while walking or are you focussed on the route?
  • How far from home do you usually go to take a walk? Do you start your walk straight from where you live or do you go somewhere (by car, bike, public transport) specifically in order to have a walk?
  • On a scale from 1 to 10 how well are you informed about your surroundings (natural, cultural…)? Where do you feel you could use more data? 
  • Do you search on the internet in order to get to know your area and the city you live in?
  • Do you usually look up or prepare the route or are you open to discover new areas?
  • Do you use some apps in order to orientate yourself when going for a walk? Which ones?
  • How do you feel about the idea of having an app which provides routes with nice sceneries for walking?
  • What would you change it the Koomot app to make it better for your usage?
  • Would you like to receive interesting facts, in the form of push notification, about your surroundings while walking?
  • Is there anything else you would like to add?

The interview took around 30min. Those questions were just a starting point for a conversation. The answers were collected by writing notes during the interview, and improving them afterwards.

Questionnaire:

This is the questionnaire that we have disseminated in our community: https://docs.google.com/forms/d/e/1FAIpQLSfTPrB_u4pLkw10Ci1R9CT3WBkAz2iArutgk6ejpvcr3y-1ew/viewform

We have 56 answers, 50% of which are from those who identify as male, and 50% female.

Assignment reflection:
In this assignment we learnt more about different techniques of data gathering for the project. The three of us, together, came up with the interview questions and questionnaire, meaning we decided in team on the main points and ideas we want to get from this step of our research pipeline. One team member conducted the interview alone, since, due to the pandemic, it was not possible otherwise. We do not see any things that went wrongly. In our opinion we got what we wanted, we learnt some valuable information for our app from both interview and the questionnaire.

[A#2, P5] Sleepy Heads – Data Gathering

Our Plan

1. What are the goals of our data gathering session? What do we want to find out?

Our goal is to find out the requirements of the target group for such an application and what possible functions there are that we haven’t taken into consideration yet. We would also like to find out about the process at sleep labs and how the data collection is done.

2. What kind of people do we want to gather data from? Who are our participants?

Our participant is a person from our target group, who has been struggling with sleeping problems for many years and has also previously had experience with sleeping labs. Our participant is 27 years old and is not currently studying or working.

3. What is our data gathering method?

Which method will we be using and why?
We will be gathering data by conducting an in-depth interview with a person from our target group. As an additional data gathering method, we will be analysing existing sleep-tracking apps.

What type of interview?
Semi-structured

What kind of data do we want to gather?
Qualitative detailed data

4. How we decided to handle the topics pilot study & data recording?

We will conduct a pilot study with someone from a closer circle (as in a friend or family member) in order to make sure all questions are clear and understandable.

The data recording will be done via 1 interviewer and 2 recording clerks. If possible, the interview will also be recorded.

Preparation and conduction of our in-depth interview

1. Where to find our interview script?

You can find our interview script on page 2 of this blog post.

2. How we decided to conduct the interview?

Who took notes?
Angelika and Yasemin took notes. (We had decided to have 2 recording clerks instead of 1 to make sure we don’t miss out on any information if the interview is not recorded.)

Who asked the questions?
Tanita, as she knows the interviewee, we decided this would be best in order to make the interviewee feel as comfortable as possible during the interview.

3. Where to find the collected data?

You can find a summary of the collected data on page 2 of this blog post.

Conduction of one other data gathering method

1. What method did we choose and what type of data did we decide to gather?

We decided to conduct a market analysis to collect further data on our topic.
The questions that most interested us during this analysis where what our competition is doing and what we could do to outshine them.

2. Where to find the collected data?

You can find a summary of the collected data on page 2 of this blog post.

[A#2, P8] Datenerhebung

Define the goals of your data gathering session

Zuerst wollen wir erfahren, was die größten Probleme sind, die aktuell bei Online Brettspielabenden bestehen, um danach anhand dieser Funktionen Prioritäten vergeben zu können. Weiterhin wollen wir erfahren wie und in welchem Umfang die Nutzer vor Corona und jetzt Brettspielabende gestalten um unsere Nutzer besser kennenzulernen und besser einzuschätzen wie sie die Anwendung nutzen würden. Auch wollen wir erfahren wie die Nutzer sich den „perfekten“ Brettspielabend vorstellen.

Based on your goal, derive the kind of people you want to gather data from

Unsere Teilnehmer für die Umfrage sind Personen die gerne Brettspiele spielen und eher jünger (wahrscheinlich eher Studenten). Für das Interview befragen wir 2 Freunde.

Decide on your data gathering method

Which methods are you using and why?

Zusätzlich zu den Interviews werden wir auch noch eine Umfrage durchführen, da die Daten die sich hier sammeln lassen deutlich besser vergleichbar sind und sich schneller/einfacher auswerten lassen sind dafür allerdings nicht so detailliert. Die Interviews dagegen sollen uns sehr detaillierte Antworten bringen, was für Probleme und Wünsche es gibt.

What type of interview (structured, unstructured, semi-structured)?

Wir planen ein semi-strukturiertes Interview durchzuführen. Wir werden ein Größtenteils wird es ein strukturiertes Interview sein, allerdings wenn es um Problembeschreibung oder Wünsche geht werden wir die Fragen offen stellen.

What kind of data do you want to gather?

Das Interview ist vor allem daraus ausgelegt qualitative Daten zusammen, die Umfrage dagegen soll hauptsächlich quantitative Daten sammeln.

Decide how you handle the topics pilot study & data recording.

Pilot Study

Wir haben die Pilot Study aufgrund der kurzen Zeit ausschließlich für die Umfrage durchgeführt um dafür zu sorgen, dass die Fragen verständlich für den Teilnehmer der Umfrage sind. Hierfür haben wir uns ein paar Personen aus unserem Bekanntenkreis Gesicht, die sich dass angeschaut haben.

Data Recording

Interviews: schriftliche Notizen – Die sind einfacher Auszuwerten und meistens akzeptierter bei Interviewpartner als Aufnahmen

Umfragen: Tabellen und Diagramme, die automatisch vom Umfrage Tool erzeugt werden.

[A#2,P4]

Define the goals of your data gathering Session

What do you want to find out?

Das Ziel unseres Interviews soll sein, einen detaillierten Einblick in den Prozess der Prüfungsschemata zu bekommen. Dabei sollen wesentliche Fragen für uns geklärt werden, sodass wir wichtige Features in unserer App erkennen können. Obendrauf wollen wir mehr über den Lernprozess der Jurastudenten herausfinden. Wo lernen sie? Welche Medien nutzen sie? Das soll uns dabei helfen zu entscheiden, welches Format die Anwendung haben soll.

Based on your goal, derive the kind of people you want to gather data from

Das Interview wird mit Tade (einem Jurastudenten) durchgeführt. Danach wollen wir weitere Jurastudenten mit Hilfe einer Online-Umfrage nach ihren Eindrücken befragen.

Decide on your data gathering method

Which methods are you using and why?

Das Interview mit Tade wird dazu genutzt ein besseres Verständnis zu erlangen. Ein Interview ist die perfekte Gelegenheit die Abläufe der Prüfungsschemata zu hinterfragen. Gerade weil keiner in unserer Gruppe Erfahrung in Jura besitzt, ist es einfacher domain-spezifische Aspekte mitzunehmen, indem wir ein semi-structured Interview verwenden. Mit dem Wissen, das wir durch das Interview generiert haben, erstellen wir dann eine Umfrage. Die Umfrage ist hilfreich, um zu klären welches Format die Anwendung haben soll. Zu dem hilft die Umfrage, bei der Einschätzung der Features.

What Type of Interview?

Das Interview ist ein semistrukturiertes, weil wir nicht genug Wissen über Jura und die Prüfungsschemata besitzen um ein strukturiertes durchzuführen. Jedoch semistrukturiert statt unstrukturiert, weil wir durch Assignment 1 eine ungefähre Richtung schon besitzen.

What kind of data do you want to gather?

Das Interview soll uns qualitative Daten liefern. Mit der Umfrage wollen wir quantitative Daten generieren. Die quantitativen Daten sollen dabei unsere qualitativen Daten quantifizieren.

Decide how you handle the topics pilot study & data recording

Die Pilotstudie führen wir mit Tade durch für die Umfrage. Dadurch kann Tade nochmal bestätigen, ob wir seine Eindrücke korrekt aufgenommen haben oder nicht. Das Interview wurde durch Notizen und eine Audiodatei aufgezeichnet und im Anschluss zusammengefasst. Für die Audiodatei habe wir von Tade eine Einverständnis über ein Consent-Form bekommen. Das Resultat der Umfrage wird als CSV Datei in Google Drive gespeichert. 

Reflexion

Wer hat welchen Beitrag geleistet?

Tobias hat das Interview mit Tade durchgeführt und die Ergebnisse für uns noch einmal zusammengefasst. Simon war zuständig für die Fragen des Interviews und das erstellen der Google Forms Umfrage. Meine [Anil] Aufgabe war es, den Blogbeitrag zu verfassen, zudem habe ich Fragen zum Interview mitgestaltet. Die Fragen für die Online-Umfrage wurden von uns allen erstellt.

Was habt ihr gelernt?

Das während eines Interviews Fragen aufkommen die essentiell sind an die man vorher eventuell nicht gedacht hat. Das man im Interview so viel spaß haben kann, so dass man dabei Gefahr läuft, Zeit und Thema aus den Augen zu verlieren.

Was lief gut?

Die Teamkoordination war diese Woche sehr gut. Jeder wusste wann er was machen musste und es verlief alles reibungslos. Das Interview selbst verlief auch erfolgreich und es freut uns dass Tade auch spaß hat.

Was möchtet ihr verbessern?

Die Woche verlief gut wir würden gerne auf diesem Level weiter machen

[A#2, P7] Veritas – Data

  • Project 7
  • Week 2

  • Define the goals of your data gathering session.
    The goal of our study is to gather information on how people of age group 50+ form their opinions on political topics, i.e., how many and which sources are used. Additionally, we attempt to find out whether they consider their own opinion biased or balanced. We want to also know how they life in social media looks like and their daily usage of news.
  • Based on your goal, derive the kind of people you want to gather data from.
    We needed people of age 50+ for our interviews. Survey, however, was sent to wider range of people to get bigger picture on the problem. Through this survey we were also looking for participants over 50 years old.
  • Decide on your data gathering method.
    We use two methods. First, we conduct a questionnaire targeted at the general public, which we will post on forums and mailing lists. In parallel, partially based on preliminary results from the questionnaire we conduct in-depth interviews with multiple participants of our target group of age 50+.

    Our interviews are semi-structured. We decided, since we are going to talk about politics, we need to give our interviewed a space for longer responses and to share their opinion on the problem.
  • Decide how you handle the topics pilot study & data recording.
    For data recording we used: Audio recording and notes for personal interviews and video recording for a remote interview. Achieved transcription from the interviews will be used as a main source for us.

    We use Google Forms as questionnaire software. They will provide us with categorized and counted solutions in the form of Excel sheet. We will be working from there on the next assignments.

Reflection:

We took our time to rethink thouroughly the questions for participants of our survey and interview. There was a lot of brain storming to decide what data do we want to gather from the public. Working together on the file was very helpful and time saving.

What surprised us, was the response for our survey. We got more replies than we expected and we hope that this is going to make our work more clear in next assignments. Our topic is definitely a wide area and a controversive one. We hope for more questions to answer and more solutions to provide.

In terms of how the interviews went, we are happy how did it go and with data we were able to gather. Some information and ideas came up during them, that we didn’t predict before. The biggest struggle was avoiding leading questions, as the main topic is politics and media, where each person can have it’s own, original opinion.

Also thanks to the survey we conducted, we could get a feedback from our responses about the questions and the problem. Opened questions in the survery, allowed our responders to state their opinion and some of them we followed up by the discussion on our meeting.